
|
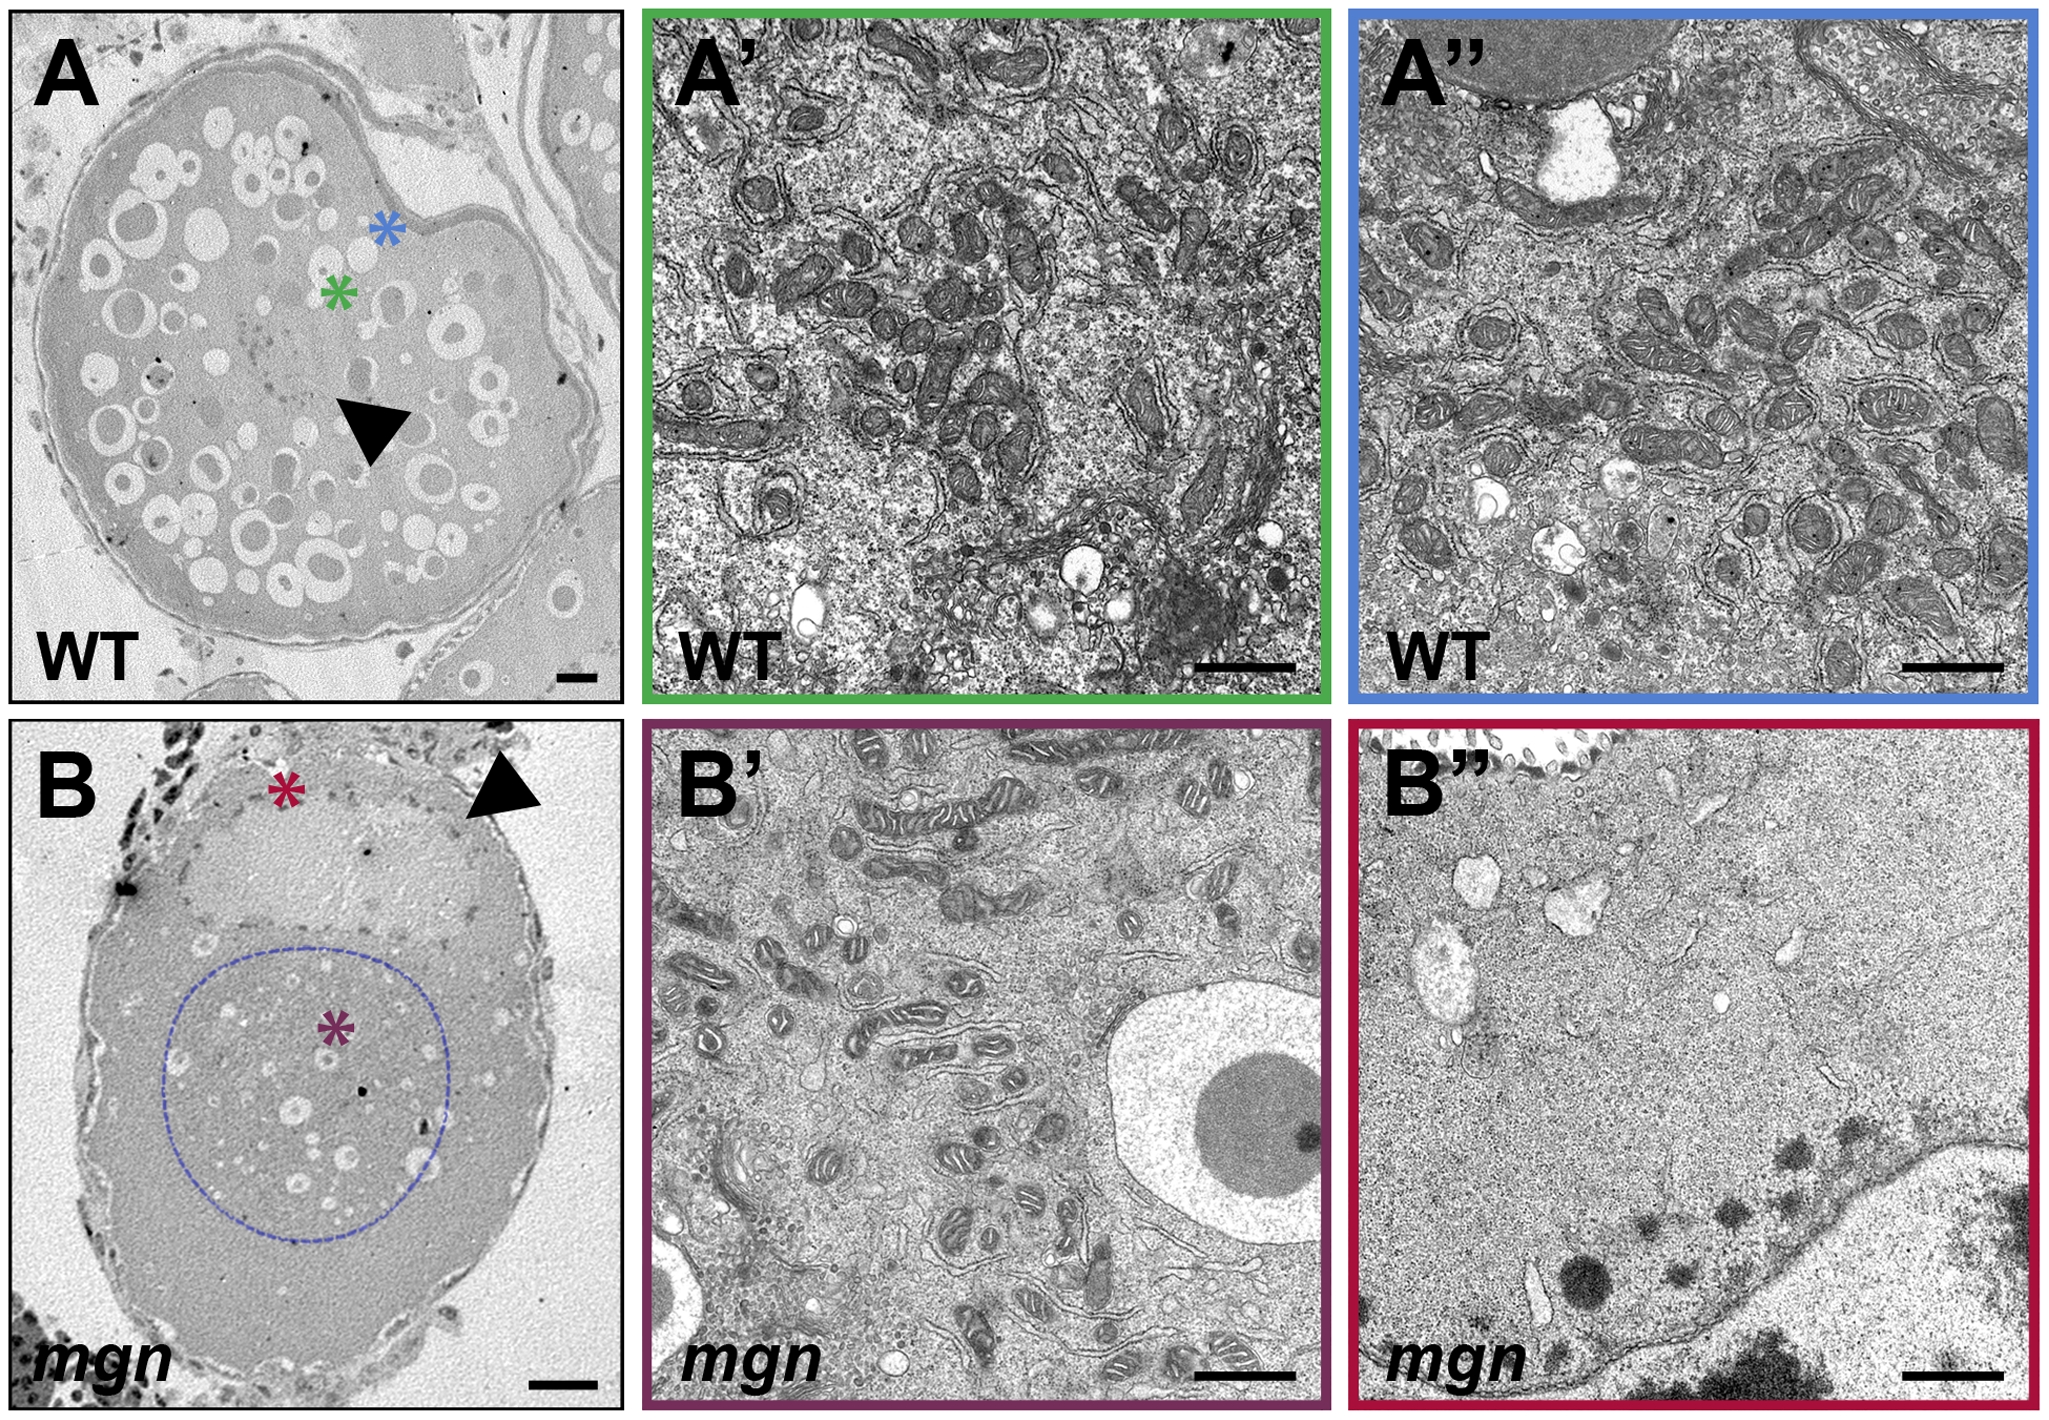
Fig. 7 ER and mitochondria are absent from the periphery of stage II mgn mutant oocytes.
Transmission electron micrographs of stage II wild-type (A–A″) and mgn mutant (B–B″) oocytes. ER and mitochondria are distributed throughout wild-type stage II oocytes (A–A″) but are absent from the periphery of stage II mgn mutant oocytes (B–B″). Arrowheads indicate oocyte nuclei. Positions of regions shown at high magnification (A′, A″, B′ and B″) are indicated by the respective colored asterisks in A and B. Dashed blue line outlines the electron dense region in which most of the ER and mitochondria are located. Scale bars = 20 microns (A, B) and 1 microns (A′, A″, B′ and B″).