|
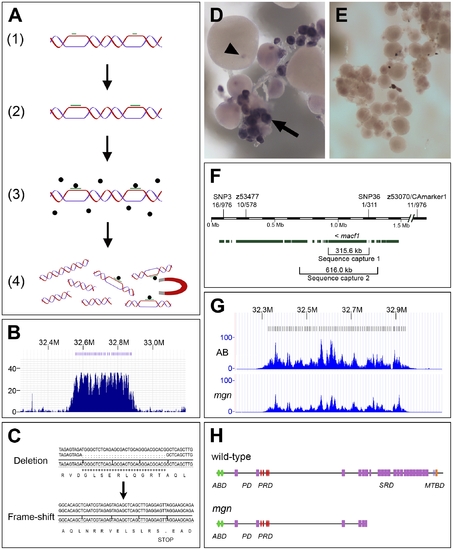
The molecular lesion in mgn mutants was identified by a combination of genomic sequence capture and massively parallel sequencing. (A) Schematic diagram depicting sequence capture method, which involves: 1) Hybridization of oligos (green bars) to long genomic DNA fragments at approximately 8 kb intervals; 2) Extension of oligos with biotinylated nucleotides; 3) Capture of targeted DNA with magnetic streptavidin-coated beads; 4) Extraction of captured DNA. (B) Histogram showing read depth for the 319.8 kb sequence capture region within a 0.9 Mb genomic interval. Increased read depth in the targeted region reflects the 243-fold average enrichment of the captured sequence (x-axis = chromosomal region containing targeted interval; y-axis = number of reads aligned to the region). Oligo binding positions are depicted as blue bars at the top of the figure. (C) 31 base pair deletion in macf1 in mgn mutants that results in a frame-shift and premature stop codon. Sequence at top shows the deletion from a heterozygous sibling; sequence at bottom shows the frame-shift in a homozygous mutant. (D–E) In situ hybridization of macf1 probe to wild-type (D) and mgn mutant (E) oocytes. macf1 is expressed in stage I wild-type oocytes (D, arrow) and is localized to a restricted domain during mid to late oogenesis (D, arrowhead). Levels of macf1 transcript are reduced in mgn mutant oocytes (E). (F) Genomic interval showing SSLP and SNP markers used for mapping, candidate genes, and sequence capture regions. macf1 is transcribed from the reverse strand. Hash marks indicate 0.5 Mb of sequence not shown. Annotation based on Ensembl Zv7/danRer5 with additional annotation information from Zv8/danRer6. (G) Histograms showing read depth for the 616 kb sequence capture region within a 0.9 Mb interval. The increased read depth within the targeted region reflects the 72- and 43-fold enrichment of captured sequence from the AB and mgn mutant (TU) genomic DNA, respectively. Oligo binding positions are depicted as bars at the top of the figure. (H) Predicted protein structure of zebrafish Macf1 (Pfam database) and expected truncation in the spectraplakin domain. Actin binding domain (ABD), Plakin domain (PD), Plakin repeat domain (PRD), Spectraplakin repeat domain (SRD), Microtubule binding domain (MTBD). Green = Calponin homology domain; purple = Spectrin domain; red = plakin domain; blue = EF hand domain; orange = GAS2 domain.
|