
- Title
-
The ERRalpha orphan nuclear receptor controls morphogenetic movements during zebrafish gastrulation
- Authors
- Bardet, P.L., Horard, B., Laudet, V., and Vanacker, J.M.
- Source
- Full text @ Dev. Biol.
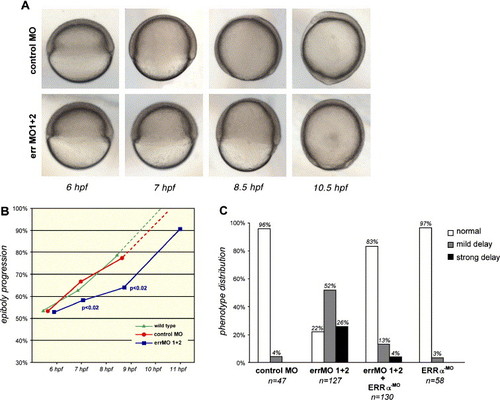
Effect of ERRα-targeting MOs on zebrafish epiboly. (A) Side views (dorsal to the right) of embryos injected either with the control MO (upper panels) or with two ERRα-targeting MOs (errMO 1+2; lower panels) at different stages of development (hours post-fertilization {hpf} are indicated, according to the one of the control and wild type embryos). (B) Mean epiboly progression at different times after fertilization of wild type (green line), controlMO- (red line) and errMOs-injected (blue line) embryos. Note that wild type and control MO embryos have already reached the tail bud stage at the last time point (dashed line). Except for this last case, P values of the Student′s t test are indicated when significant (n> = 6). (C) Strength of epiboly delay as evaluated by microscopic observation when the control embryos reached 80% of epiboly. Embryos were scored as unaffected, mildly or strongly delayed. Number of embryos examined for each condition is indicated below the graph. |
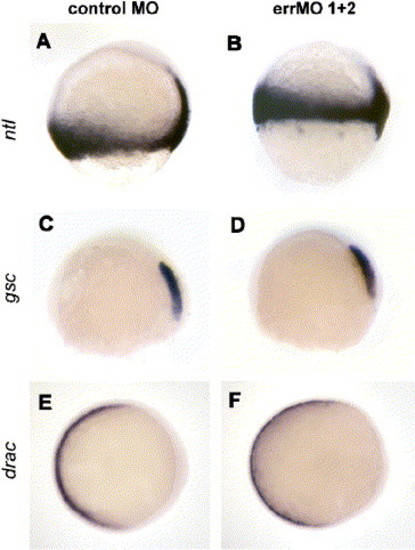
Expression of notail, goosecoid and draculin markers in morphant embryos. Expression of notail (ntl, lateral view, A–B), goosecoid (gsc; lateral view; C–D) and draculin (drac; animal view; E–F) genes were determined by in situ hybridization on 8 hpf embryos injected with control MO (A, C, E) or with ERRα-targeting MOs (B, D, F). Dorsal side to the right. EXPRESSION / LABELING:
|
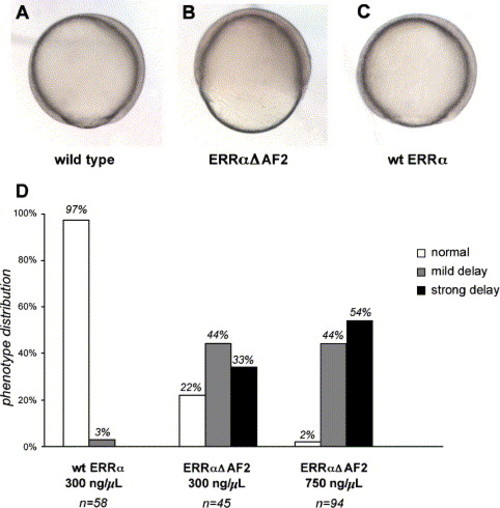
Effect of ERRα encoding mRNAs on epiboly. (A–C) Side views of 9 hpf embryos injected with RNA (300 ng/μl) encoding either the dominant-negative ERRαΔAF2 (B) or wild type ERRα (C) compared to the uninjected embryos (A). (D) Dose-dependence of the epiboly delay induced by dominant-negative ERRα mRNA. Wild type or ERRαΔAF2-injected embryos (at the indicated concentrations) were scored as unaffected, mildly or strongly delayed when control embryos reached 80% of epiboly. Number of embryos examined for each condition is indicated below the graph. |
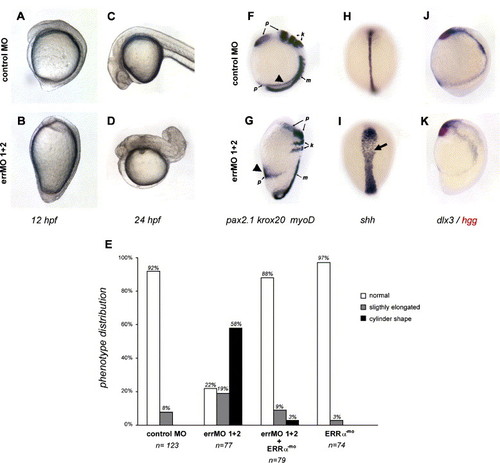
Effect of ERRα-targeting MOs on zebrafish later development. (A–D). Lateral views of living embryos (control MO- (A,C) or errMO- (B,D) injected) at 12 hpf (A–B, dorsal to the right) and at 24 hpf (C–D). (E) Strength of the observed phenotypes. Injected embryos were scored at 12 hpf as unaffected, caudally elongated or cylinder shaped. Number of embryos examined for each condition is indicated below the graphe. (F–K) In situ hybridization with a mix of myoD (m), pax 2.1 (p) and krox20 (k) probes (F–G, lateral views, dorsal to the right), shh probe (H–I, dorsal views) or hgg (in red) and dlx3 (J–K, lateral views, dorsal to the right), on embryos at 12 hpf, injected either with control MO (F, H, J) or errα targeting MO (G, I, K). Note the pronephric ducts (F–G, arrowheads) in a ventral position in errMO-injected animals. shh expression domain (I, arrow) is enlarged, but less dense, in the morphant as compared to control. All embryos presented here did not display a strong delay in epiboly. EXPRESSION / LABELING:
|
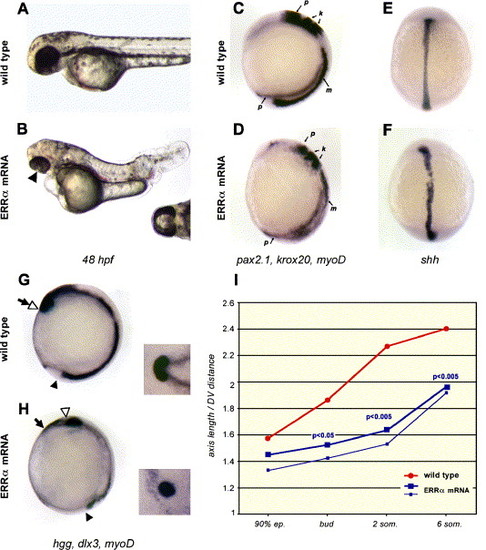
Axis length reduction in ERRα encoding RNA-injected embryos. (A–B) Lateral views of wild type (A) and ERRα-injected embryos (B) at 48 hpf. Note the tail shortening and the cyclopia of the injected embryo (arrowhead and ventral view of the head in the inset). (C–H) Uninjected (C, E, G) or ERRα mRNA injected (D, F, H) embryos hybridized with a mix of myoD (m), pax 2.1 (p) and krox20 (k) probes (C–D, lateral views of 12 hpf embryos, dorsal to the right), shh probe (E–F, dorsal views of 12 hpf embryos) or hgg, dlx3 and myoD (G–H, lateral views of 11 hpf embryos, dorsal to the right; insets: anterior views of the head). Note that the prechordal plate, labeled by the hgg probe (open arrowhead), has migrated to the tip of the anterior head (delimited by dlx3 expression, arrow) in wild type (G) but not in ERRα mRNA injected (H) embryos. (I) Axis length of wild type (red line) and ERRα mRNA injected (large blue line) from 90% epiboly to 6 somites stages. Axis length is the distance from the tail bud (black arrowhead in panels G–H) to the anterior tip of the head (arrow in panels G–H). P values of the Student′s t test are indicated when a significant difference of the length is measured. Distances between the tail bud and the prechordal plaque (open arrowhead in G–H) have been plotted for ERRα mRNA injected embryos (thin blue line). This distance in wild type embryos is identical to axis length. EXPRESSION / LABELING:
|
Reprinted from Developmental Biology, 281(1), Bardet, P.L., Horard, B., Laudet, V., and Vanacker, J.M., The ERRalpha orphan nuclear receptor controls morphogenetic movements during zebrafish gastrulation, 102-111, Copyright (2005) with permission from Elsevier. Full text @ Dev. Biol.