
IMAGE

Fig. 9

ID
ZDB-IMAGE-260311-291
Genes
Source
Figures for Luo et al., 2025
Image
Figure Caption

Fig. 9

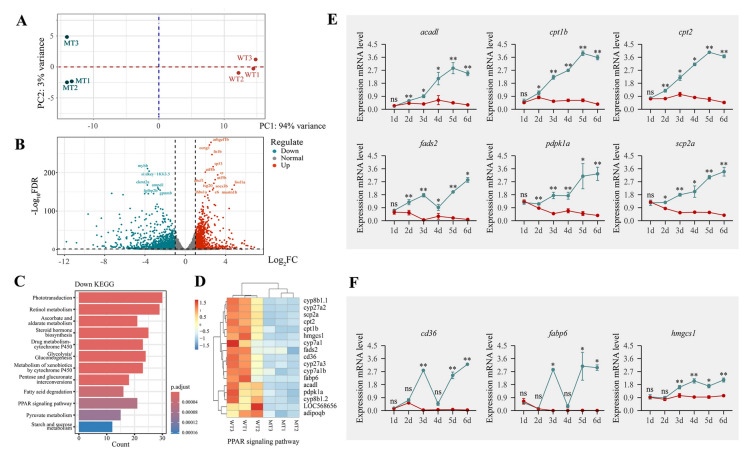
Mutations in gtf3aa disrupt metabolic pathways. A PCA of transcriptomic data from three gtf3aa−/− mutants and three gtf3aa+/+ larvae at 3 dpf. B Volcano plot of differential gene expression between gtf3aa−/− and gtf3aa+/+ larvae. C KEGG pathway enrichment showing downregulated pathways in gtf3aa−/− mutants. D Heatmap of significantly downregulated genes in the PPAR signaling pathway in gtf3aa−/− larvae. E, F Temporal expression of key metabolic genes in the PPAR pathway (acadl, cpt1b, cpt2, fads2, pdpk1a, scp2a, cd36, fabp6, and hmgcs1) from 1 to 6 dpf in gtf3aa−/− compared to gtf3aa+/+ larvae. β-actin was used as the reference gene

Figure Data
Acknowledgments
This image is the copyrighted work of the attributed author or publisher, and ZFIN has permission only to display this image to its users. Additional permissions should be obtained from the applicable author or publisher of the image. Full text @ Mar Life Sci Technol