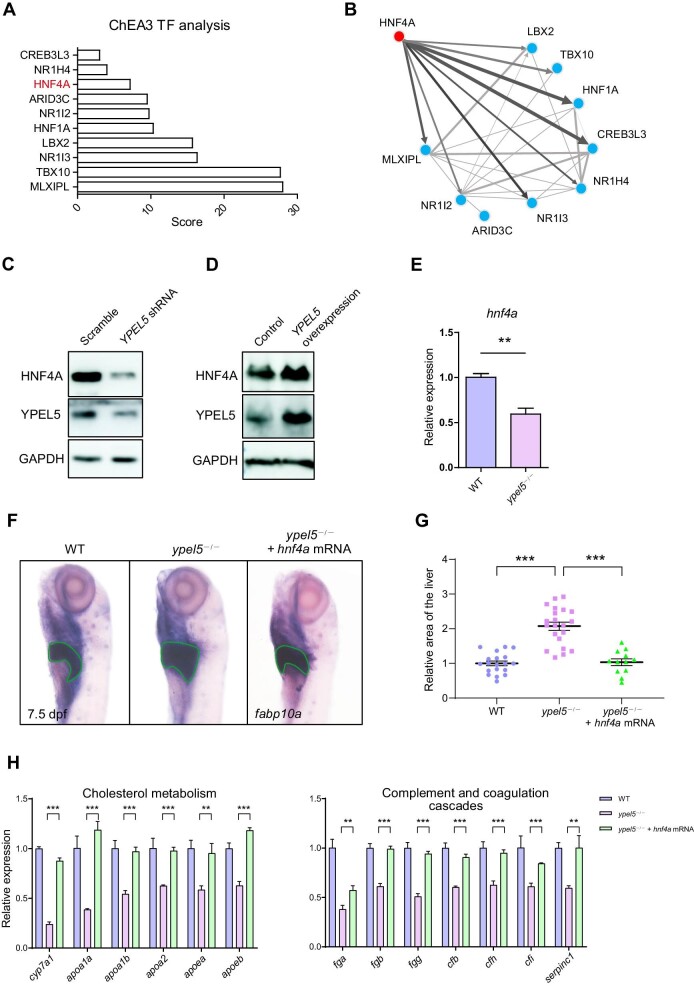
IMAGE

Figure 4

ID
ZDB-IMAGE-231023-7
Source
Figures for Deng et al., 2023
Image
Figure Caption

Figure 4

Hnf4a acts as a crucial downstream effector of Ypel5. (A and B) ChEA3 transcription factor (TF) analysis was performed on differentially expressed genes. The top 10 proteins and their co-regulatory networks are shown. (C and D) Western blot analysis of HNF4A in Huh-7 cells. (E) qPCR analysis of hnf4a expression in control siblings and ypel5−/− mutants at 3 dpf. (F and G) WISH assay of fabp10a (F) and relative liver size (G) of zebrafish larvae at 7.5 dpf. Green lines circle the boundary of the liver. (H) qPCR analysis of genes related to cholesterol metabolism and complement and coagulation cascades. Data shown are mean ± SEM. Student's t-test. **P < 0.01; ***P < 0.001.

Acknowledgments
This image is the copyrighted work of the attributed author or publisher, and ZFIN has permission only to display this image to its users. Additional permissions should be obtained from the applicable author or publisher of the image. Full text @ J. Mol. Cell Biol.