
Figure 5
|
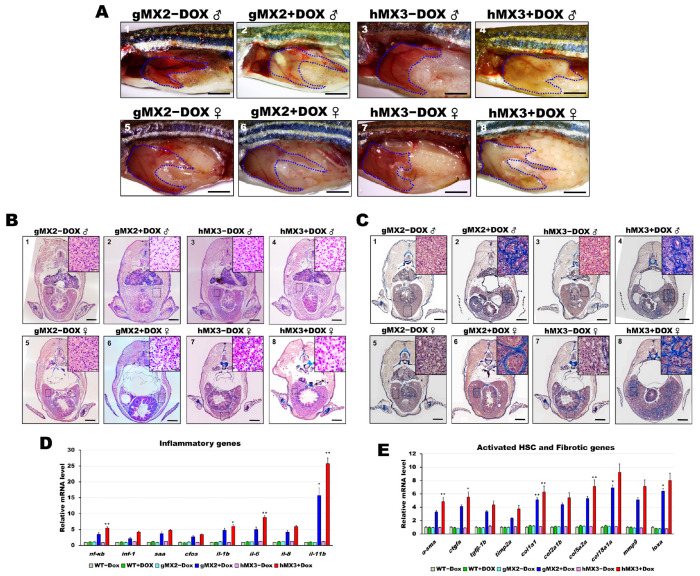
Figure 5 Nonalcoholic steatohepatitis (NASH) phenotypes in gMX2 and hM3 zebrafish at 8 mpf. (A) Gross liver of gMX2 ± Dox and hMX3 ± Dox male (panels 1–4) and female (panels 5–8) zebrafish at 8 mpf. The livers are circled. Scale bar: 2 mm. (B) H&E staining shown increased Mallory−Denk bodies (MDBs) with ballooned cells and lobular inflammation (panels 1–4 for male and panels 5–8 for female). Scale bar: 1 mm. Insets: normal hepatocytes (panels 1, 3, 5, and 7), MDBs and lobular inflammation (panels 2, 4, 6, and 8). Scale bar: 25 μm. (C) Masson’s trichrome staining of the liver tissue from gMX2 ± Dox and hMX3 ± Dox (panels 1–4 for male and panels 5–8 for female zebrafish). Scale bar: 1 mm. Insets: normal hepatocytes (panels 1, 3, 5, and 7); fibrosis (panels 2 and 6) and scar tissue linked with liver fibrosis (panel 4) and cirrhosis (panel 8). Scale bar: 25 μm. (D) qRT-PCR analysis of gMX2 and hMX3 NASH discovered upregulated inflammatory genes and (E) activated HSC and fibrotic genes. Statistically significant differences from the controls are indicated by * (p < 0.05), and ** (p < 0.01).