
Fig. 2
|
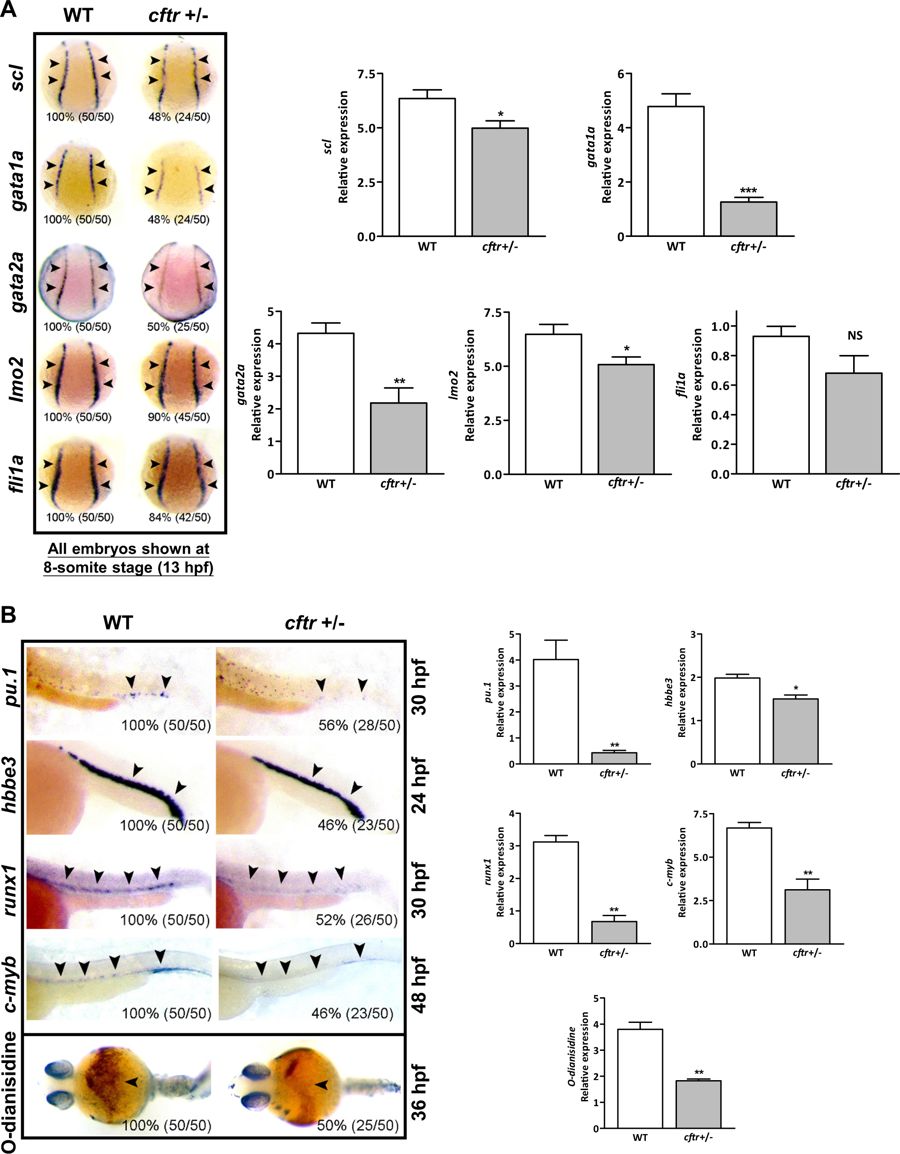
Fig. 2
Cftr critically regulates hematopoiesis in zebrafish.
a cftr mutants show hematopoietic defects at 8-somite stage (13 hpf). Embryos shown are dorsal views with anterior oriented at the top. b cftr mutants show hematopoietic defects at later stages. Embryos shown are lateral views with anterior to the left. Bottom panel: cftr mutants displayed decreased hemoglobin staining by O-dianisidine. Embryos shown are ventral views with anterior to the left. Arrowheads indicate the expression sites of each marker gene. All genes were assayed by WISH. Histogram representing the relative expression detected by signal strength grayscale using software ImageJ at corresponding assay. The percentage and numbers indicated in each picture are the ratio for the number (left in bracket) of affected embryos with phenotype similar to what is shown in the picture and the total number (right in bracket) of observed embryos. The same number labeling was used thereafter