
Fig. 3
- ID
- ZDB-IMAGE-171114-3
- Genes
- Publication
- Luo et al., 2016 - Syndecan-4 modulates the proliferation of neural cells and the formation of CaP axons during zebrafish embryonic neurogenesis
- All Figures
- Figures for Luo et al., 2016
|
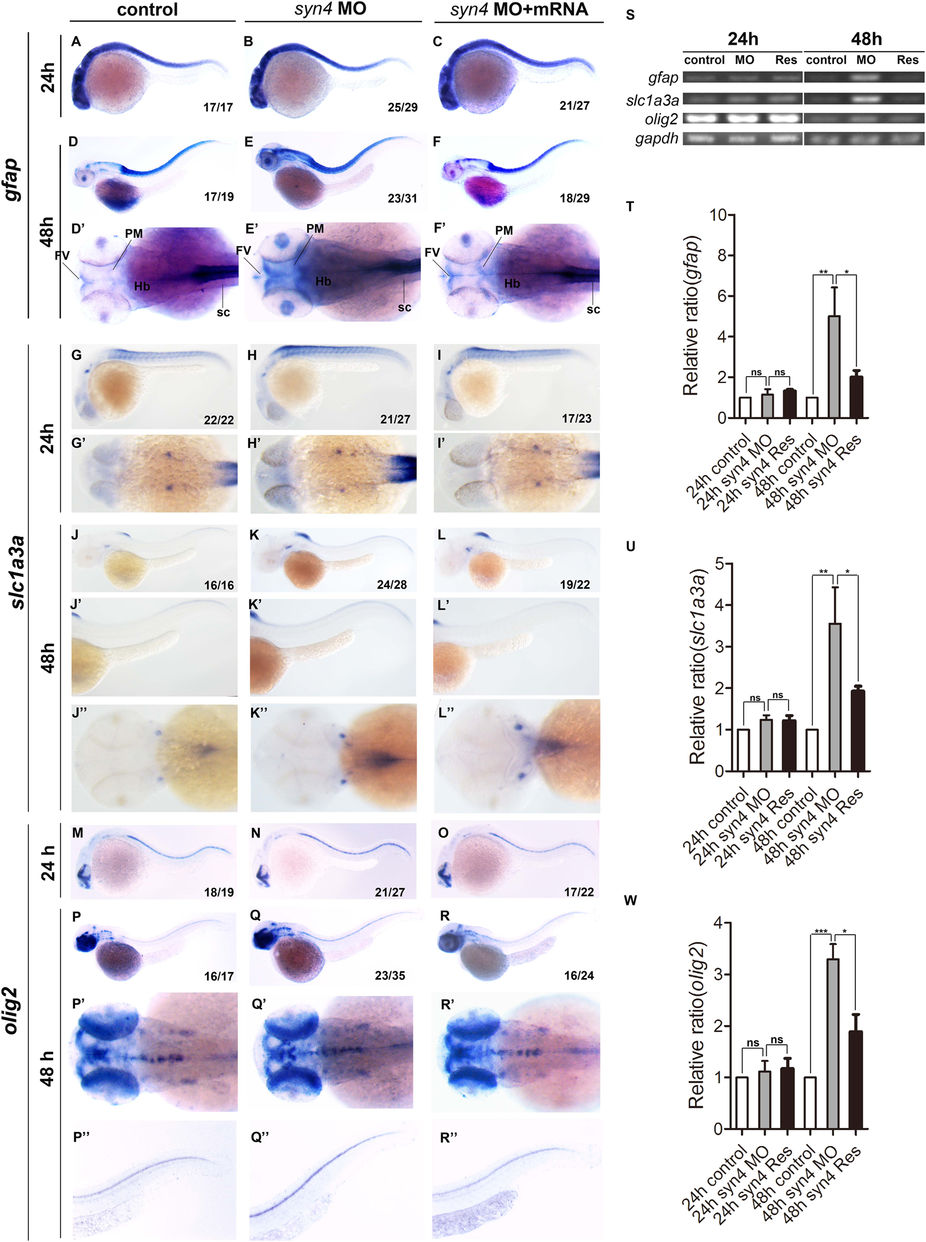
Fig. 3
Loss of syn4 increased neuroglial cells.
(A–R'') WISH results of gfap (A–F''), slc1a3a (G–L'') and olig2 (M–R'') at 24 hpf and 48 hpf in zebrafish. (D–F') The expression of gfap, (J–L'') slc1a3a, (Q–R'') olig2 are higher in the syn4 morphants than controls at 48 hpf. (S) sqRT-PCR analyzes of the transcript level of gfap, slc1a3a and olig2. (T–W) Densitometric quantification of sqRT-PCR. The syn4 morphants shown a higher expression level of gfap, slc1a3a and olig2 (mean ± s.e.m, n = 3, ***P < 0.001, **P < 0.01, *P < 0.05, ns = not significant, Student's unpaired t-test). FV: ventricular zone in forebrain, Hb: hindbrain, PM: posterior midbrain, sc: spinal cord. Lateral views, dorsal to the top and anterior to the left in (A–C,D–F,G–I,J–L',M–O,P–R,P''–R''), Dorsal view, anterior to the left in (D'–F',G'–I',J''–L'',P'–R').