
Fig. 1
|
Fig. 1
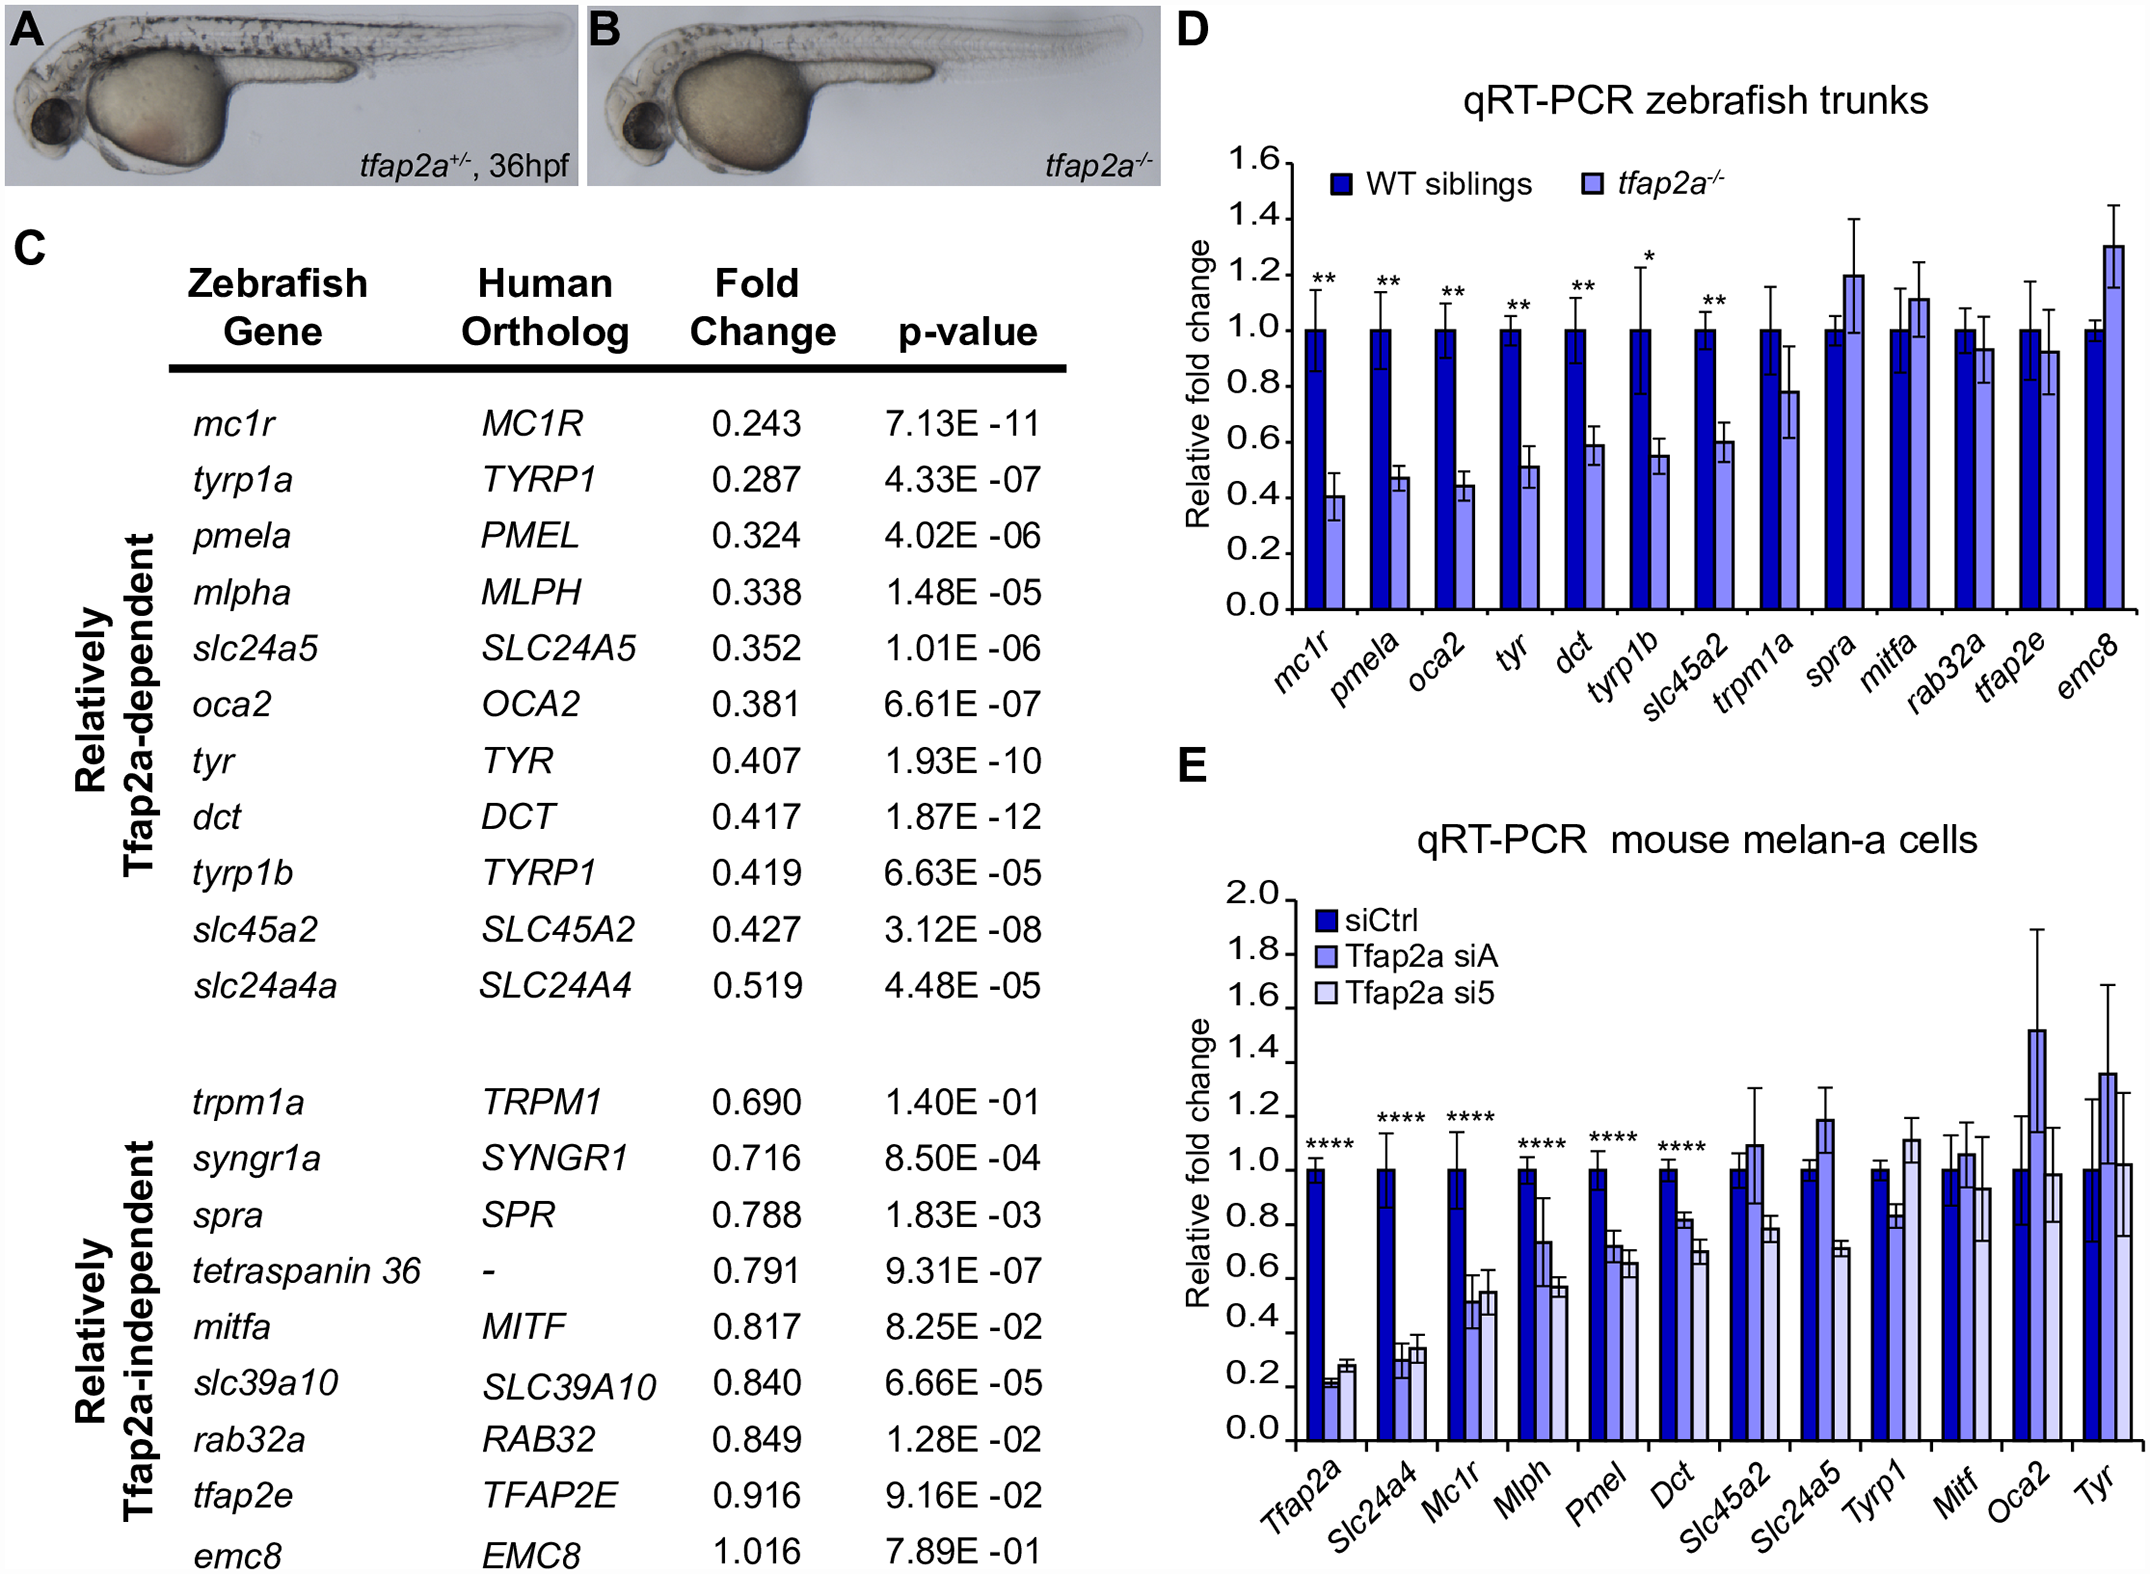
Melanocyte differentiation genes are sensitive to the loss of TFAP2A.
(A, B) Lateral images of tfap2a+/- and tfap2a-/- mutant zebrafish at 36 hpf. tfap2a-/- mutants have fewer melanocytes and delayed pigmentation relative to their wildtype or tfap2a+/- siblings. (C) Fold changes calculated from microarray expression levels for 20 zebrafish melanocyte genes. Top: 11 genes with expression levels between 0.2–0.55-fold in tfap2a-/- mutants compared to WT siblings. Bottom: 9 genes with expression levels reduced no further than the number of melanocytes in tfap2a-/- mutants. (D) qRT-PCR validation of zebrafish microarray results for 13 melanocyte genes (Mann-Whitney U, *p<0.05, **p<0.01). (E) qRT-PCR validation of microarray results for 12 melanocyte genes in mouse melan-a cells transfected with control siRNA or each of two siRNAs targeting Tfap2a (siA, si5). Significance evaluated only when both siA and si5 altered gene expression in the same direction relative to siCtrl (one-way ANOVA with Bonferroni correction, ****p<0.0001).