
Fig. 3
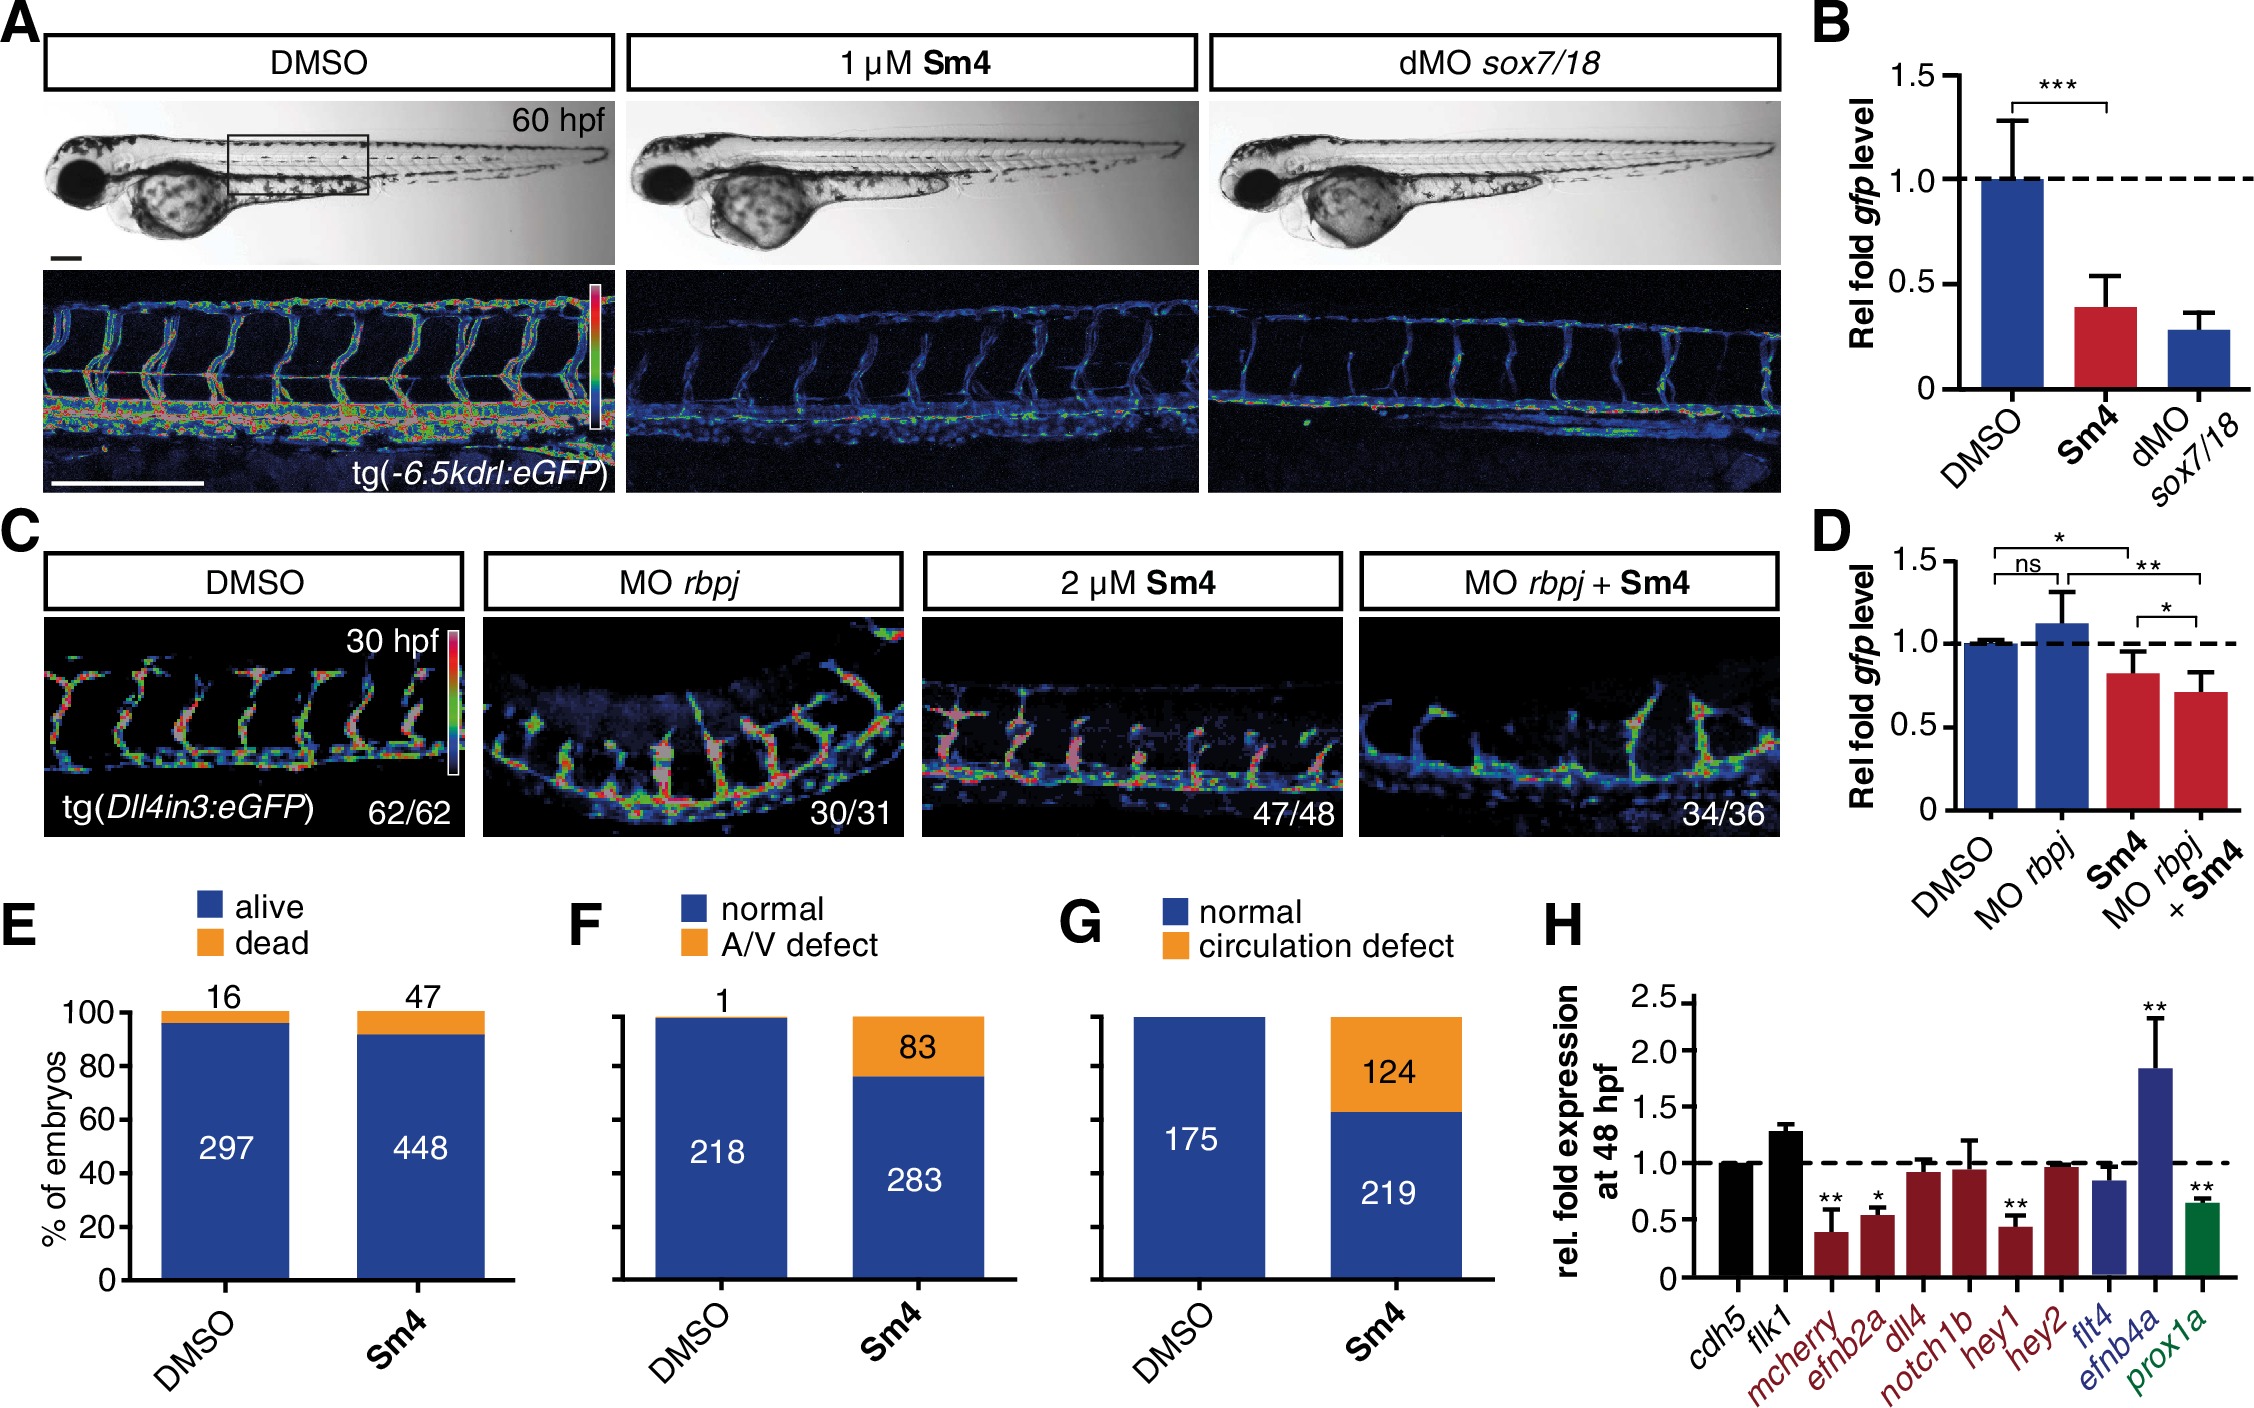
|
Fig. 3
Sm4 blocks SoxF transcriptional activity in vivo.
(A) Lateral brightfield (top) and fluorescent (bottom) images of 60 hpf zebrafish larvae carrying the tg(−6.5kdrl:eGFP) SoxF reporter. Treatment was initiated at late stage (20 hpf) with either DMSO (negative control) or 1 μM Sm4, or larvae were injected with morpholinos against both sox7 and sox18 (dMO sox7/18). Fluorescence intensity is shown as heatmap. Scale bar 200 μm (B) qRT-PCR analysis on gfp transcripts levels in treated tg(−6.5kdrl:eGFP) larvae and sox7/18 morphants, showing reduction of activity on this transgene. (C) Lateral view of zebrafish larvae carrying the tg(Dll4in3:eGFP) SoxF/Notch reporter that harbors multiple binding sites for Rbpj and SoxF transcription factors. Larvae were injected with a morpholino against rbpj and/or treated with 2 μM Sm4 from 13 hpf. (D) qRT-PCR analysis on gfp transcripts in tg(Dll4in3:eGFP) larvae, showing repression of combined SoxF/Notch activity in the Sm4-treated larvae. (E) Quantitation of embryonic lethality in larvae, treated with Sm4 or DMSO control from early stage (16 hpf) until 72 hpf. (F) Penetrance of vascular phenotype (arteriovenous shunting) in 48 hpf larvae treated with 1.5 µM Sm4 from 16 hpf. (G) Penetrance of circulation defect in 48 hpf larvae treated with 1.5 µM Sm4 from 16 hpf. (H) qRT-PCR analysis of endogenous endothelial transcript levels at 48 hpf in larvae treated with 1.5 µM Sm4 at 16 hpf, relative to DMSO control (dotted line). Data shown are mean ± s.e.m. *p<0.05, **p<0.01, ***p<0.001.