
Fig. 5
|
Fig. 5
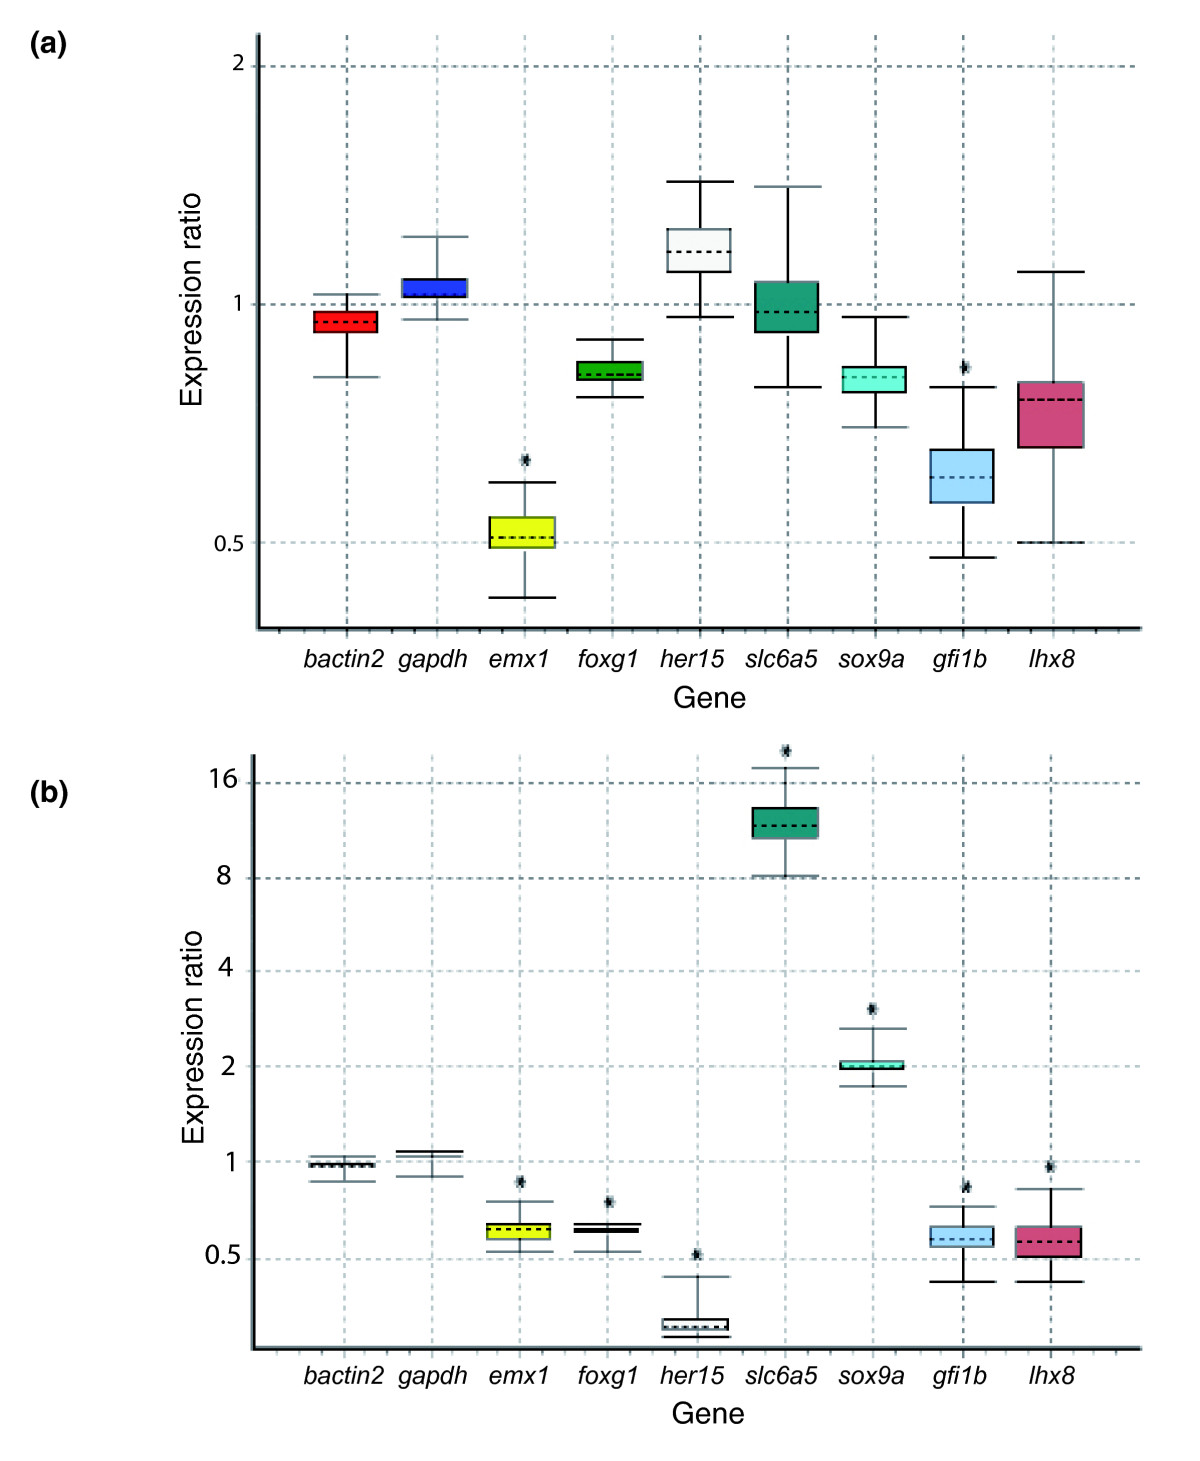
Validation and categorization of transcripts in acute and/or chronic response to amphetamine using quantitative PCR. qPCR was performed on the brain of fish injected with one dose (acute) or 18 doses of amphetamine (chronic). (a) Two genes, gfi1b and emx1, were downregulated after one dose of amphetamine. (b) The remaining transcripts were down- or up-regulated in the same direction as the microarray in the chronic situation. The figures show box plots of relative gene expression, where the top and the bottom of each box indicate the 75th and 25th percentiles, respectively, whereas the dotted line represents the median. Asterisks indicate that the probability of the alternative hypothesis (that the difference between sample and control groups is only due to chance (P(H1)) being correct is ≤ 0.05 (see also Materials and methods).