
Fig. S3
- ID
- ZDB-IMAGE-161104-32
- Genes
-
- afg1lb
- aftphb
- ak9
- arhgef18b
- ccdc78
- ccdc162
- ces3
- cfap20dc
- cfap161
- cfap206
- chia.4
- clic6
- cp
- dlec1
- drc9
- fank1
- fgfbp2b
- gb:co360592
- hhipl1
- il1rapl2
- illr4
- kcnip1a
- kif6
- lect2.1
- lrrc51
- magi3b
- masp1
- myo15b
- plcxd2
- s100a10a
- scg5
- si:ch211-71m22.1
- si:ch211-195b15.7
- si:dkey-26i13.8
- si:dkey-165a24.9
- si:dkey-224e22.2
- slc43a3a
- spa17
- stx19
- tp53bp2b
- trak1b
- ttll7
- wdr27
- zbbx
- zgc:153738
- Publication
- Choksi et al., 2014 - Systematic discovery of novel ciliary genes through functional genomics in the zebrafish
- All Figures
- Figures for Choksi et al., 2014
|
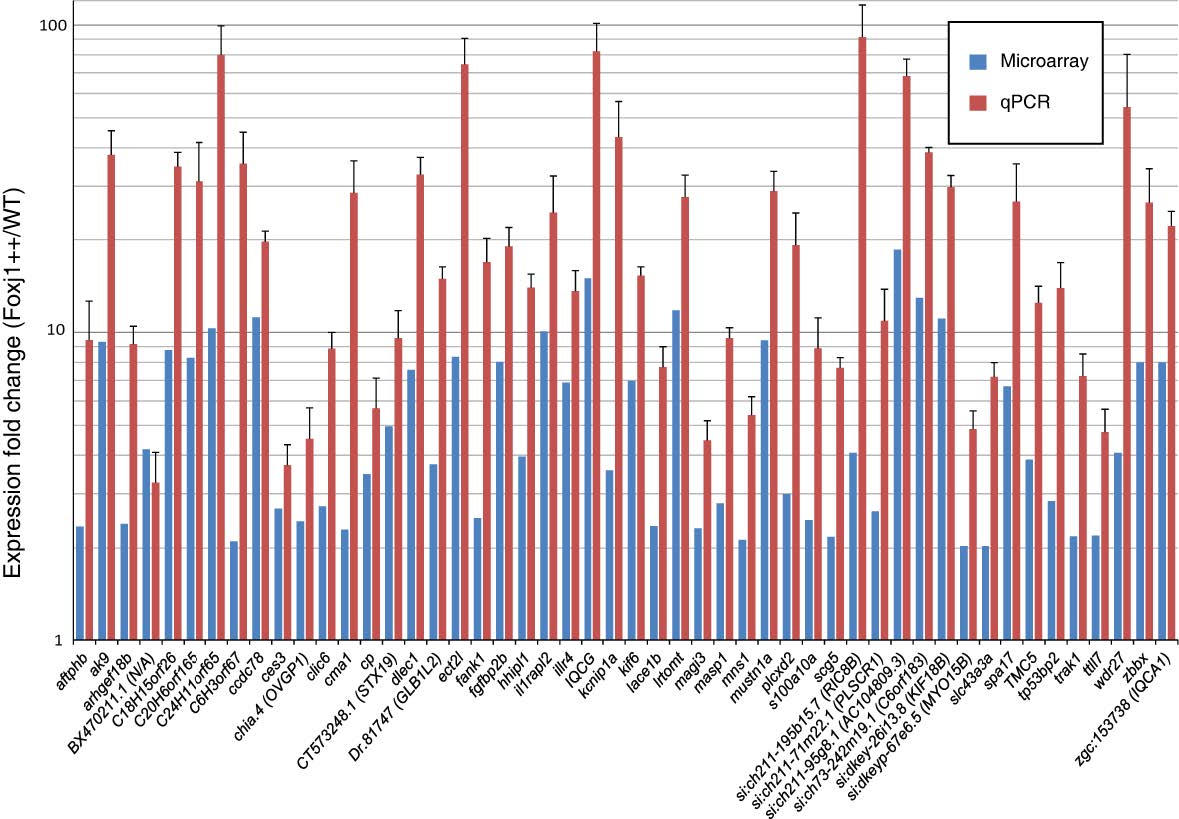
Fig. S3
FIGs are enriched in embryos overexpressing Foxj1 as measured by microarray analysis and RT-qPCR. Fifty three genes were selected randomly from the set of genes up-regulated by Foxj1 as determined by microarray analysis. The induction of 50 of these genes was confirmed using reverse transcription and quantitative (RT-qPCR) to compare transcript levels in embryos overexpressing Foxj1 to wild type embryos. These 50 genes showed a substantial increase in expression in response to Foxj1 overexpression. Blue bars indicate the expression fold change as measured by microarray analysis while red bars indicate expression changes measured by RT-qPCR. The y-axis is in a logarithmic scale (log10), error bars are standard errors of the mean. All results are significant by a Student’s t-test (p < 0.05).