
|
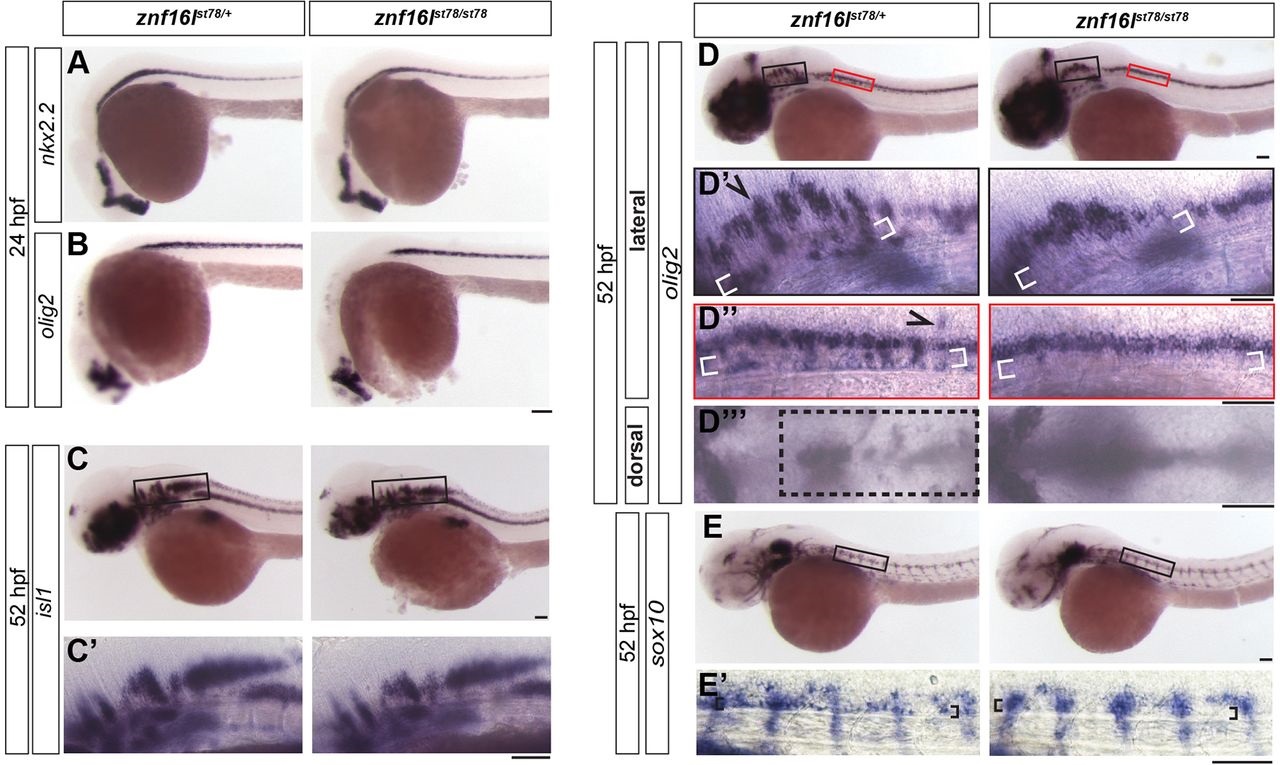
Fig. 2
Developmental disruptions in znf16l mutants are specific to the oligodendrocyte lineage. (A,B) znf16l mutants displayed normal expression of nkx2.2 (A) and olig2 (B) at 24hpf. (C,C2) znf16l mutants also displayed normal expression of the motoneuron marker islet1 at 52hpf. (D,E) Defects in znf16l mutants were specific to cells in the oligodendrocyte lineage. (D-D4) olig2 is expressed by oligodendrocyte-lineage cells and a subset of motoneurons. The expression pattern of olig2 in wild-type siblings revealed groups of cells that had migrated dorsally (arrowhead), ventrally (white brackets) and laterally (box). These cell populations are missing or reduced in the mutants. D2 and D3 show regions in black and red boxes, respectively, in D. (E) sox10 expression is restricted to cells of the oligodendrocyte lineage in the CNS. Wild-type siblings displayed a group of cells (brackets in E2) immediately dorsal to the notochord that were missing in the mutants, confirming the disruption of oligodendrocyte-lineage cells in znf16l mutants. The genotypes of all embryos shown were determined by PCR tests for the st78 lesion. Scale bars: 100µm.