
Image
|
Figure Caption
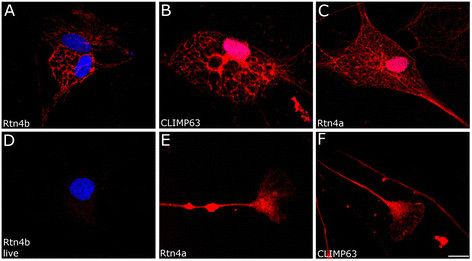
Fig. 2
Rtn4a and Rtn4b staining of ER in zebrafish oligodendrocytes. (A) Labeling of fixed zebrafish oligodendrocytes with Rtn4b reveals a reticular structure similar to the ER staining with CLIMP63 AB (B). (C) Rtn4a AB also labels ER in oligodendrocytes. (D) Exposing live oligodendrocytes to Rtn4b AB gives no cell surface staining. DAPI stains the nuclei in (A,D) and also in (B,C) where, however, the red ER stain covers the blue. (E) Zebrafish RGC axons and growth cones are labeled by the Rtn4b AB. These structures are also labeled with CLIMP63 AB (F). Scale bar, 10 µm.
Figure Data
Acknowledgments
This image is the copyrighted work of the attributed author or publisher, and
ZFIN has permission only to display this image to its users.
Additional permissions should be obtained from the applicable author or publisher of the image.
Full text @ Neural Dev.