
Fig. 7
|
Fig. 7
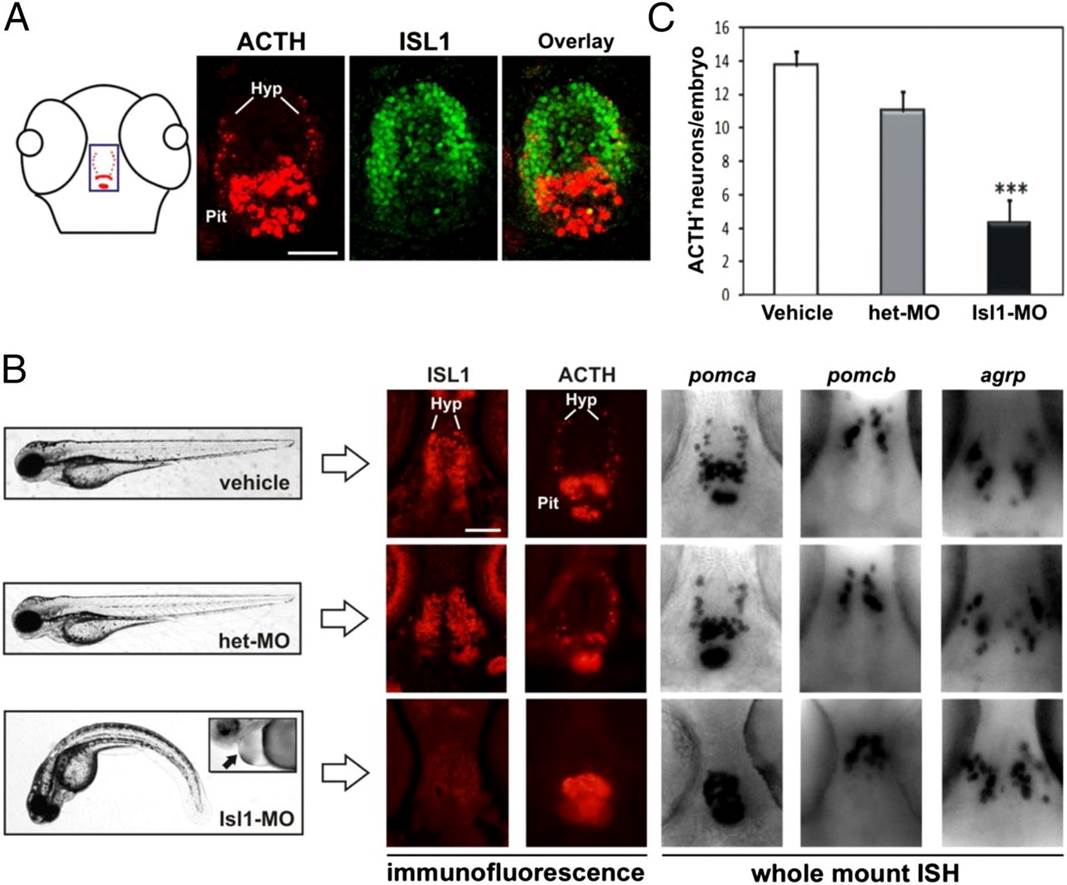
ISL1 regulates hypothalamic pomca expression in zebrafish. (A) Schematic of a 72-hpf zebrafish head in a horizontal plane showing the distribution of pomca-expressing cells in the pituitary and hypothalamus (red dots). The blue rectangle depicts the magnified area shown in the other panels. Double immunofluorescence analysis showing pomca (ACTH, red) and isl1 (green) coexpression in horizontal sections of 72-hpf zebrafish brain. (B, Left) Phenotypic characterization of 72-hpf Isl1-MO, het-MO, and vehicle-injected zebrafish. Isl1-MO larvae have reduced body size, curved down tail, and develop cardiac edema (indicated with an arrow in magnified Inset). (Right) Molecular characterization of the hypothalamus in Isl1-MO, het-MO, and vehicle-injected zebrafish embryos. Immunofluorescence (IF) analysis in horizontal brain sections of 72-hpf zebrafish shows that ISL1 knockdown completely eliminates pomca expression (ACTH) in the hypothalamus, but not in the pituitary. Whole-mount in situ hybridization (ISH) further confirms the lack of pomca expression in the brain and shows that other hypothalamic markers, pomcb and agrp, remain unchanged in Isl1-MO relative to control embryos. Hyp, hypothalamus; Pit, pituitary. (Scale bars, 50 µm.) (C) Quantification of the total number of ACTH+ neurons per embryo in Isl1-MO (n = 16)-, het-MO (n = 15)-, and vehicle (n = 28)-injected zebrafish. Bars correspond to mean + SEM. ***P < 0.001, Student’s t test vs. vehicle.