
Fig. 6
|
Fig. 6
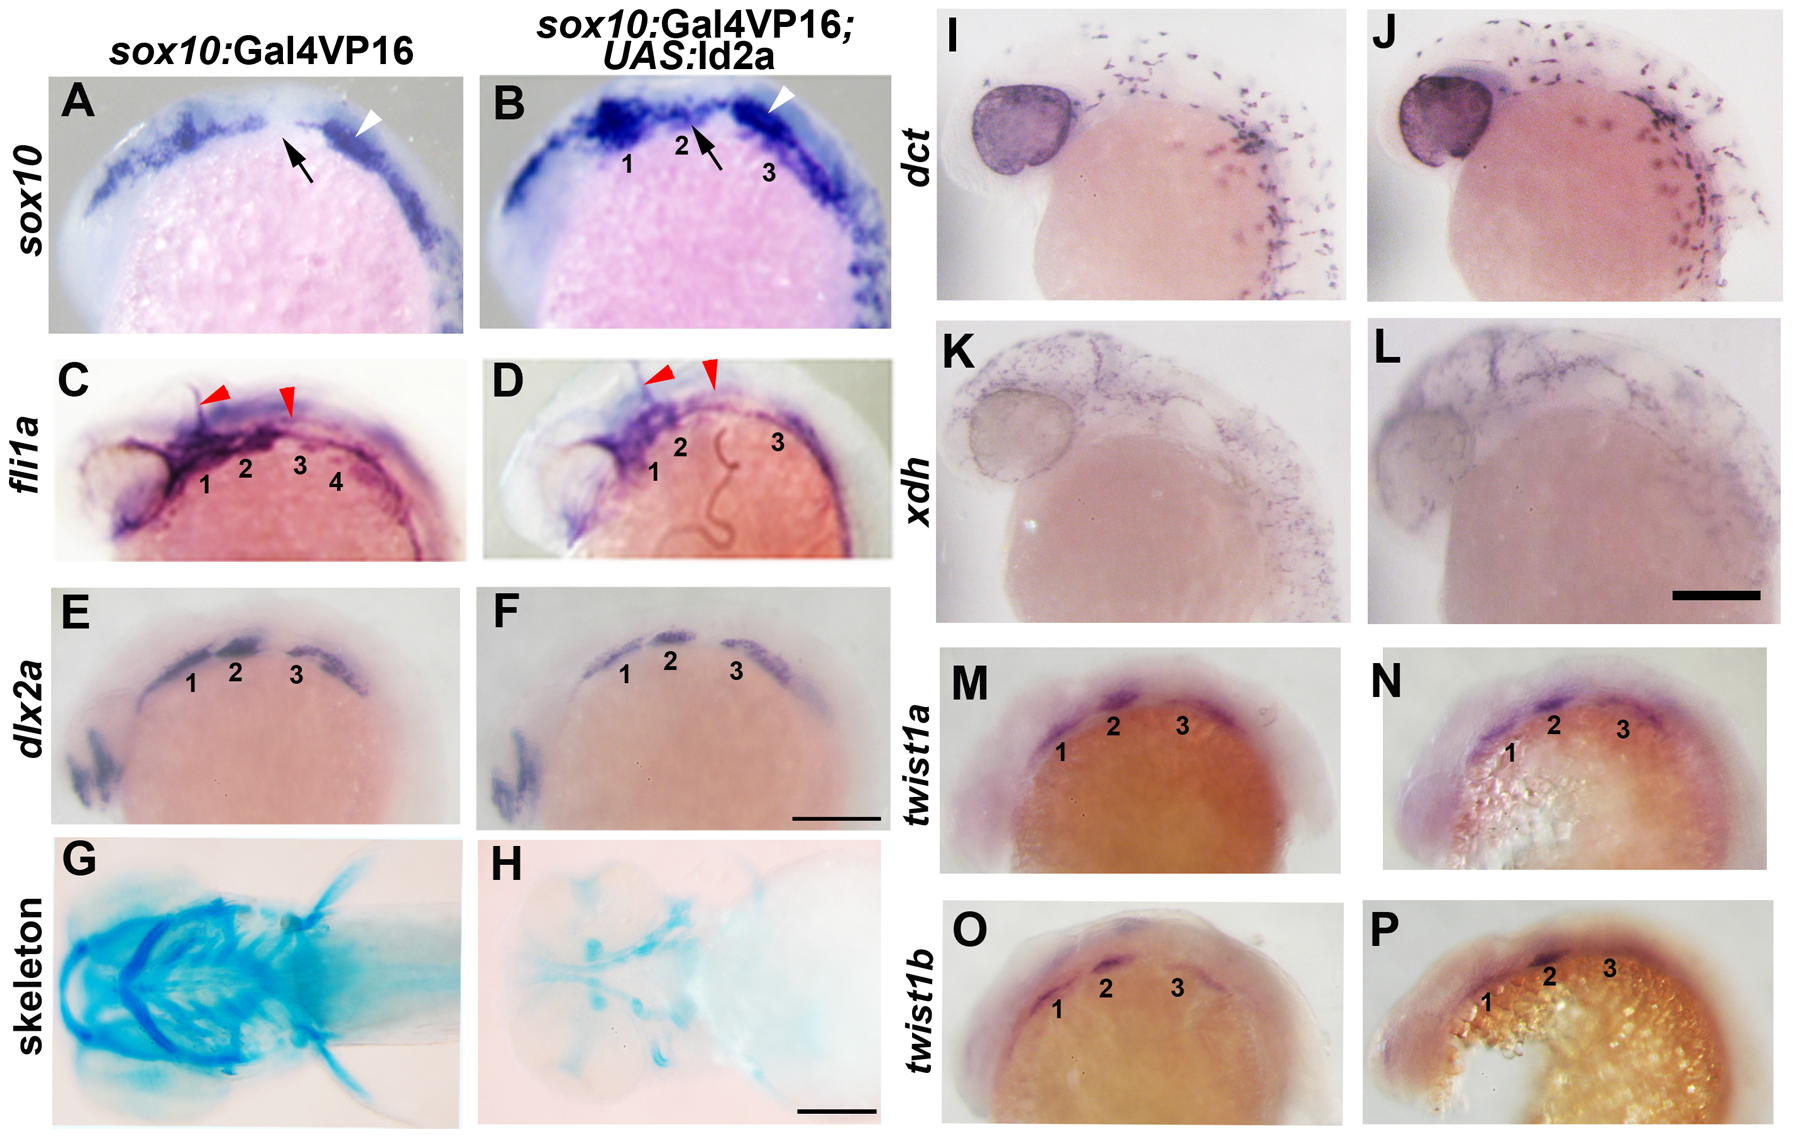
Forced expression of Id2a in CNCCs inhibits ectomesenchyme specification.
(A–F) Whole mount in situs show ectopic arch expression of sox10 at 18 hpf in sox10:Gal4VP16; UAS:Id2a embryos (n = 7/7) but not sox10:Gal4VP16 only controls (n = 0/9), loss of fli1a arch expression at 24 hpf in sox10:Gal4VP16; UAS:Id2a embryos (n = 4/4) but not sox10:Gal4VP16 only controls (n = 0/17), and mild reductions of dlx2a arch expression at 18 hpf in sox10:Gal4VP16; UAS:Id2a embryos (n = 5/5) but not sox10:Gal4VP16 only controls (n = 0/8). Arches are numbered. Arrows denote the second arch, white arrowheads the developing ear, and red arrowheads the vasculature. (G and H) Skeletal staining at 5 dpf shows severe reduction of the craniofacial skeleton in sox10:Gal4VP16; UAS:Id2a embryos (n = 17/17) compared to sox10:Gal4VP16 only controls (n = 0/22). (I and J) In situs for dct expression at 28 hpf show that melanophore precursors are unaffected in sox10:Gal4VP16; UAS:Id2a embryos (n = 8) and sox10:Gal4VP16 only controls (n = 8). (K and L) In situs for xdh expression at 28 hpf show that xanthophore precursors are unaffected in sox10:Gal4VP16; UAS:Id2a embryos (n = 4) and sox10:Gal4VP16 only controls (n = 4). (M–P) twist1a expression at 18 hpf is unaffected in sox10:Gal4VP16; UAS:Id2a embryos (n = 12) versus sox10:Gal4VP16 only controls (n = 11). twist1b expression at 18 hpf is similarly unaffected in sox10:Gal4VP16; UAS:Id2a embryos (n = 7) versus sox10:Gal4VP16 controls (n = 8). Id2a misexpression embryos are to the right in I–P. Scale bars = 50 μm.