
Fig. 1
|
Fig. 1
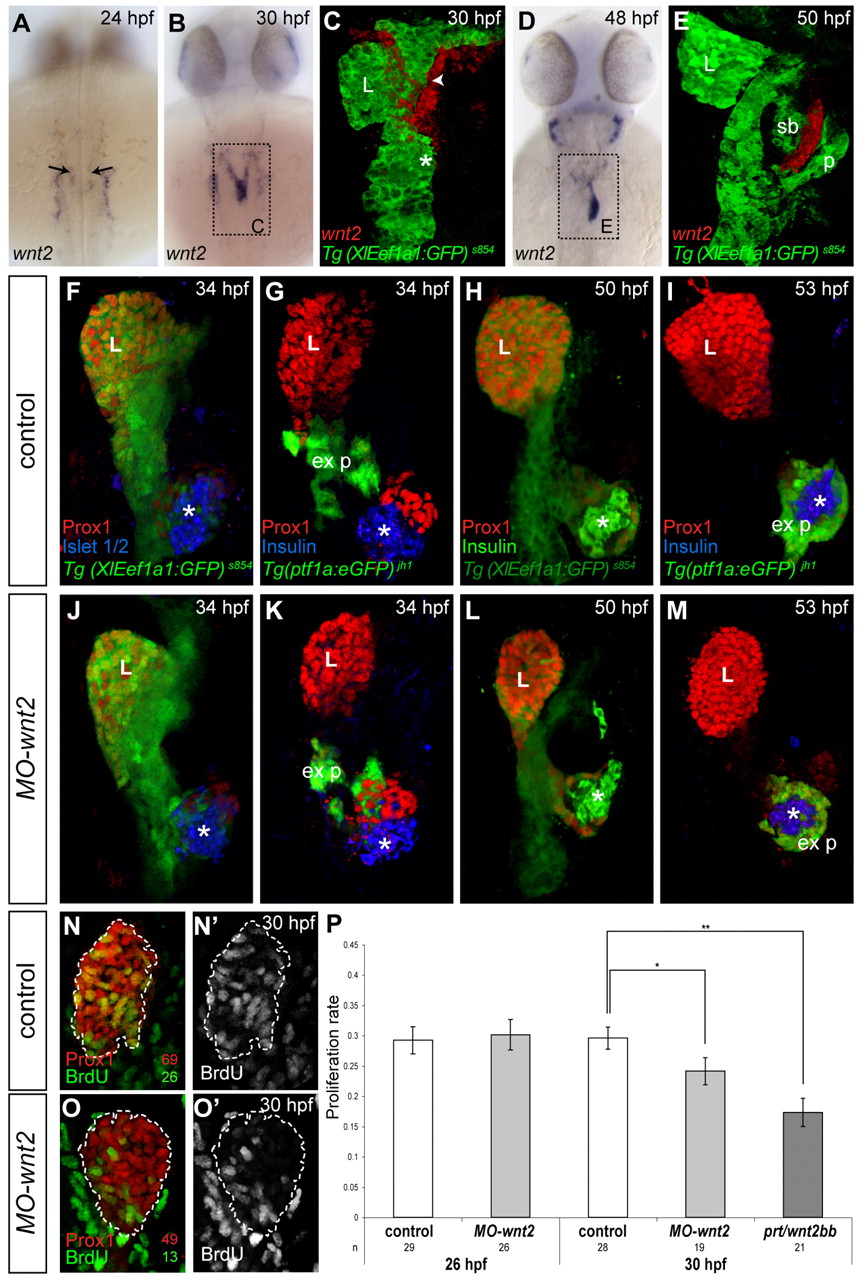
Mesodermal wnt2 controls hepatoblast proliferation. (A-E) wnt2 is expressed in bilateral LPM domains neighbouring hepatic anlage at 24 hpf (arrows, A), in the LPM abutting the proximal liver and prospective swim bladder at 30 hpf (B, arrowhead C) and confined between the swim bladder and pancreas at 50 hpf (D,E). (C,E) Projections of confocal stacks showing wnt2 mRNA (red) and Tg(XlEef1a1:GFP)s854 (green). (F-M) wnt2-depleted embryos show a mildly reduced liver at 34 hpf (J,K), which becomes more pronounced later (L,M) compared with controls (F,G,H,I). Confocal stacks showing Tg(XlEef1a1:GFP)s854 (F,H,J,L) and Tg(ptf1a:eGFP)jh1 (G,I,K,M) embryos, stained for Prox1 and Islet1/2 or Insulin, respectively. The ventral, exocrine and endocrine pancreas serve as developmental landmarks; a subset of MO-wnt2 embryos show ectopic endocrine cells (L). (N-O2) cell proliferation rates are reduced in MO-wnt2 and prt/wnt2bb embryos. Projections of confocal stacks showing 30 hpf MO-wnt2 embryos (O,O2)and controls (N,N2); numbers indicate count of individual Prox1- and BrdU-positive cells. (A-M) Dorsal views, (N-O2) ventral views; all anterior towards the top. *, endocrine pancreas; ex p, exocrine pancreas; L, liver; p, pancreas; sb, swim bladder. (P) Proliferation rates in controls, MO-wnt2 and prt/wnt2bb embryos determined by Prox1 and BrdU labelling. Standard errors are shown. Asterisks indicate the P value for each condition (*P<0.05; **P<0.001); n, number of embryos. Data are mean±s.e.m.