
Fig. 5
- ID
- ZDB-IMAGE-101101-18
- Genes
- Publication
- Kwon et al., 2009 - Mesendodermal signals required for otic induction: Bmp-antagonists cooperate with Fgf and can facilitate formation of ectopic otic tissue
- All Figures
- Figures for Kwon et al., 2009
|
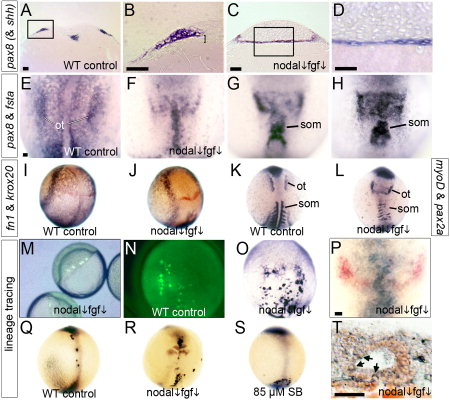
Fig. 5 Paraxial cephalic mesoderm transfates to otic tissue in Nodal-Fgf-deficient embryos. A, B: Transverse section of a wild-type control stained for pax8 and shh. B shows an enlargement of the boxed region in A, with the mesodermal layer indicated (bracket). C, D: Transverse section through the otic domain of pax8 in a fgf8+/- heterozygote treated with 70 μM SB431542. D: An enlargement of the boxed area in C. E–H: Double staining for pax8 and fsta expression (dorsal views) in a wild-type control at 11.5 h (E), and wild-type embryos treated with 70 μM SB431542 + 1 μM SU5402 and fixed at 11 hpf (F) or 11.5 hpf (G, H). The normal otic domain of pax8 (ot) and somitic expression of fsta (som) are indicated. I, J: Two-color staining for fn1 (blue) and krox20 (red) at 10 hpf in a wild-type control (I) and a wild-type embryo treated with 70 μM SB431542 + 1 μM SU5402 (J). K, L: Double staining for pax2a and myoD in a wild-type control (K) and a wild-type embryo treated with 70 μM SB431542 + 1 μM SU5402 (L). The otic domain of pax2a (ot) and myoD-expressing somites (som) are indicated. M–T: Lineage-tracing of prospective mesendoderm. Laser irradiation was used to photo-uncage fluorescein-dextran in small clusters of marginal cells of wild-type embryos treated with 70 μM SB431542 + 1 μM SU5402 (M), and embryos were fixed and stained with anti-fluorescein antibody (blue) at 9.5 hpf (O), 13 hpf (P), or 24 hpf (T). Older specimens (P, T) were also stained by whole-mount in situ hybridization for pax2a expression (red). The specimen in T shows a sagittal section (anterior to left) of a medial otic vesicle containing scattered lineage-marked cells (arrows). For comparison, lineage-labeled cells are shown in wild-type controls at 9.5 hpf (N) and 13 hpf (Q), and at 13 hpf in fgf8+/- heterozygotes treated with 70 μM SB431542 (R) or fgf8+/- heterozygotes treated with 85 μM SB431542 (S). The specimen in R also shows krox20 expression (red). Whole-mount specimens show dorsal views with anterior to the top. Scale bar = 25 μm.