
Fig. 4
|
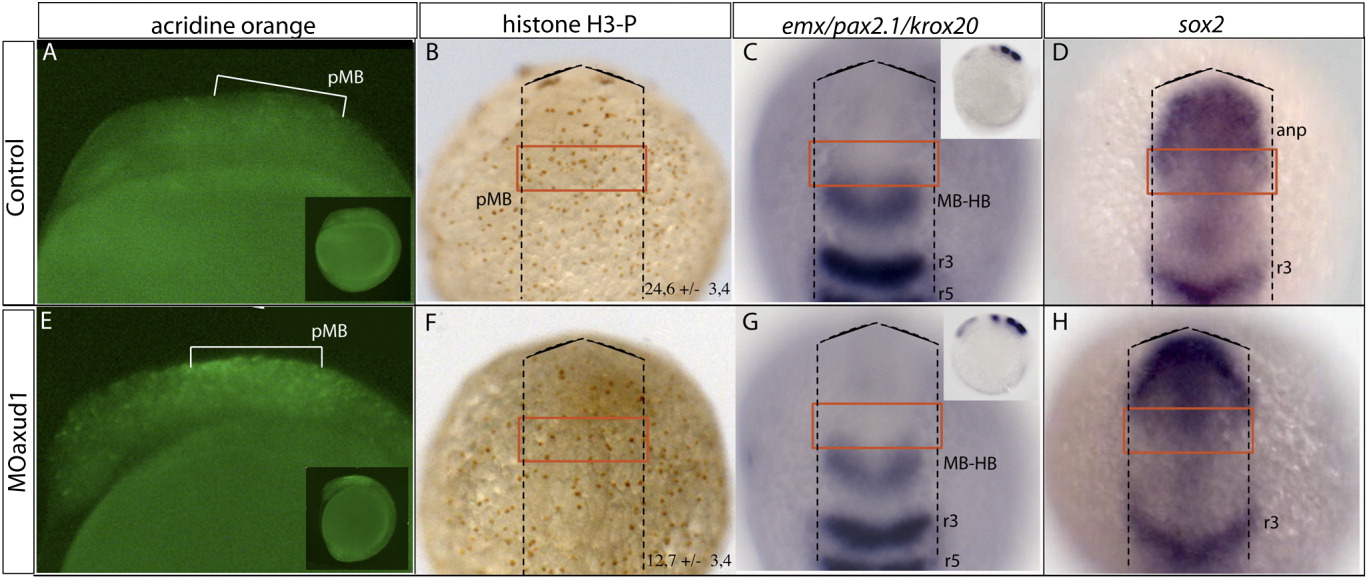
Fig. 4 axud1 morphant embryos have decreased proliferation and extensive cell death in the presumptive midbrain region. A-D: Wild type 10-hpf embryos. E-H: axud1 morphant embryos. A, E: Cell death analysis revealed by acridine orange staining of wild type (A) and morphant embryos (E). Cell death is mainly detected in the presumptive midbrain region (pMB). B, F: Proliferation analysis using the anti-phospho-histone H3 (H3-P) immunostain in wild type (B) and morphant embryos (F). The discontinuous line demarcates the embryo. The number of H-P3-positive cells quantified within the red square is markedly reduced in morphant embryos compared with wild type (24.6 ± 3.4 vs. 12.7 ± 3.4, n = 15 embryos; P < 0.001). C, G: Expression pattern of the forebrain marker emx, the midbrain marker pax2.1, and the hindbrain marker krox20 in wild type (C) and morphant embryos (G). No significant variations in the antero-posterior brain pattern are observed at this early stage. D, H: Expression pattern of the neural progenitor marker sox2 in wild type (D) and morphant embryos (H). No alterations in neural progenitor distribution or intensity of the signal are recognized. anp, anterior neural plate; MB-HB, midbrain-hindbrain boundary; pMB, presumptive midbrain; r3, rhombomere 3; r5, rhombomere 5. Lateral (A, B, E, F) and dorsal (C, D, G, H) views of 10-hpf embryos.