
Fig. 3
|
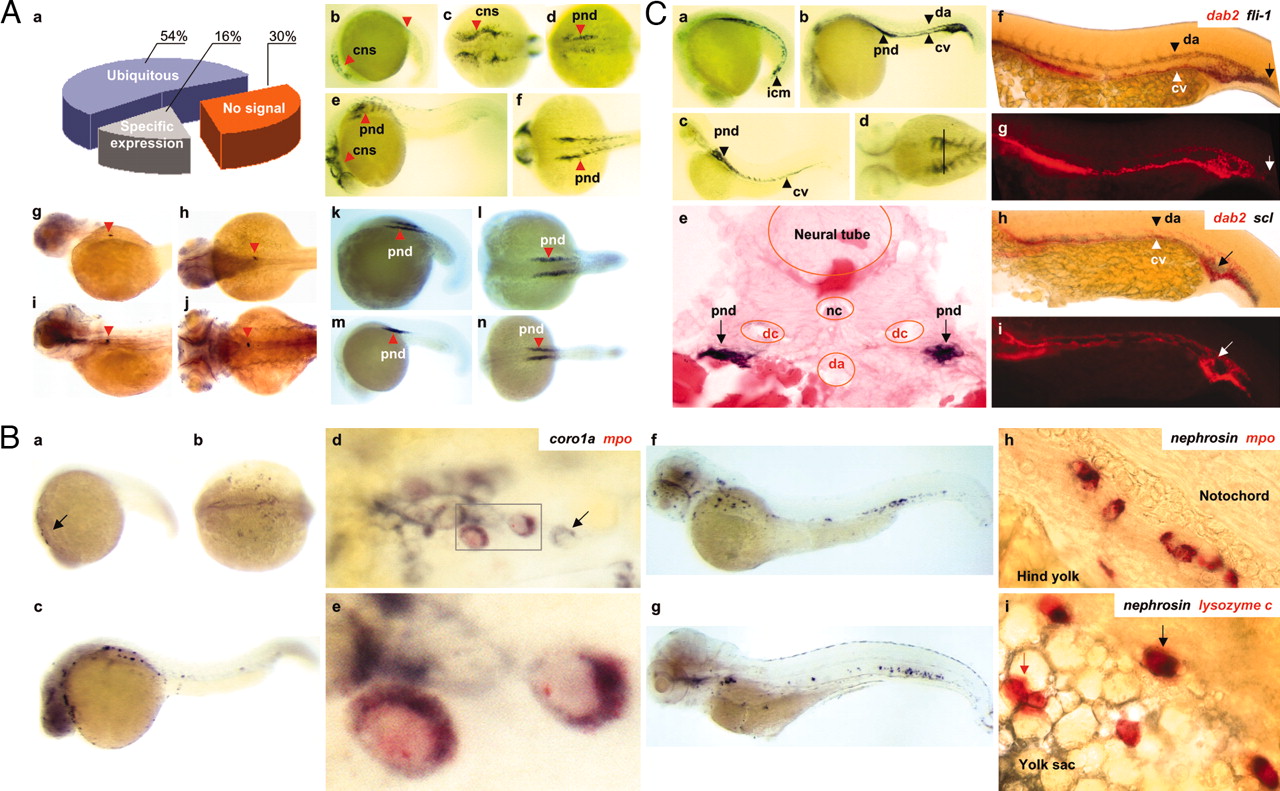
Fig. 3 Gene expression analysis with whole-mount mRNA in situ hybridization. (A) Representative examples of zebrafish genes exhibiting tissue-specific expression by WISH. (a) Categorization of gene expression patterns of 493 EST assemblies. The zebrafish orthologue of human phenylalanine hydroxylase (PAH) (Hs.325404) was expressed in the developing CNS and pnd at 18 (b-d) and 24 (e and f) hpf embryos (arrowheads). The zebrafish homologue of human RENIN (Hs.3210) was expressed in the site where the glomerulus of zebrafish kidney develops at 72 (g and h) and 120 (i and j, arrowheads) hpf embryos. The expression of a recently discovered zebrafish EST, RK011A3G03 in 18 (k and l) and 24 (m and n) hpf embryos is shown. RK011A3G03 transcripts are bilaterally expressed in the developing pnd (arrowheads). Lateral views in b, e, g, i, k, and m with dorsal upward and dorsal views in c, d, f, h, j, l, and n are shown. In all embryos, anterior is to the left. (B) Two recently discovered zebrafish genes expressed in myeloid cells. The coro1a is expressed at 18 (a and b) and 24 (c) hpf. Cells expressing both coro1a (blue) and mpo (red) are observed (d, box) and are magnified in d. The black arrow in d indicates a cell that only expresses coro1a. The nephrosin is expressed at 72 (f) and 120 (g) hpf embryos. Cells coexpressing nephrosin and mpo are observed in the posterior ICM (h). A cell coexpressing nephrosin and lysozyme c is indicated by the black arrow (i), whereas cells expressing only lysozyme c are indicated by red arrow. Dorsal view of the embryo shown in b, all others are viewed laterally with anterior to the left, dorsal upward. (Magnification, x40 in d-h, x63 in i, and x100 in e.) (C) Expression patterns of dab2. Dab2 is expressed at 18 (a) and 24 (b) hpf in pnd and ICM. Expression in the developing vasculature of the ICM includes the da and cv, as indicated. By 72 hpf, dab2 is expressed in the pnd and cv (c). (d) A magnified dorsal view of the anterior half of the embryo in c. (e) A cross section through the region marked with a vertical bar in d shows the expression of dab2 in the pnd. Two-color WISH showing the colocalization of dab2 and fli1 (f and g), but not scl (h and i) at 24 hpf (lateral views of the posterior half of the embryos, anterior to the left, dorsal upward). The expression of dab2 is shown in red in f and h and red fluorescence in g and i. Cells coexpressing dab2 and fli1 can be seen in the da and cv (arrowheads). Arrows indicate cells that express fli1 (f and g) or scl (h and i) alone. (Magnification, x40 in e.)