
Fig. 5
|
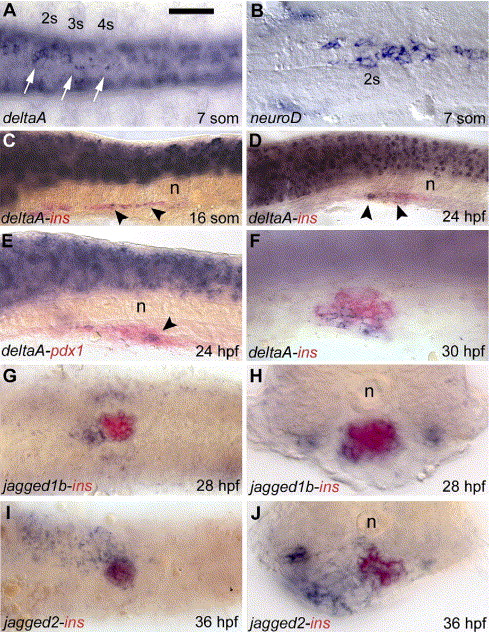
Fig. 5 Expression of Notch ligands in the pancreatic primordium. Panel A: deltaA expression in the endoderm of an embryo at the 7-somite stage. Panel B: expression of neuroD in the endoderm of an embryo at the 7-somite stage. Panels C, D, F: expression of insulin (red) and deltaA (blue) in the endoderm of zebrafish embryos. Panel E: expression of pdx1 (red) and deltaA (blue) in the endoderm of zebrafish embryos at 24 hpf. Panels G, H: expression at 28 hpf of jagged1b (blue) in cells located around the insulin (red) producing cells. Panels I, J: expression of insulin (red) and jagged2 (blue) in the endoderm of zebrafish embryos at 36 hpf. The pancreatic primordium is indicated with a black arrowhead. “n” indicates the notochord; “2s” indicates the position of the second somite. Embryos are in ventral (A, B, G, I), lateral (C–F) views with anterior to the left or transversal vibratome sections (H, J) Scale bar in panel A is 50 μm.
Reprinted from Developmental Biology, 301(1), Zecchin, E., Filippi, A., Biemar, F., Tiso, N., Pauls, S., Ellertsdottir, E., Gnugge, L., Bortolussi, M., Driever, W., and Argenton, F., Distinct delta and jagged genes control sequential segregation of pancreatic cell types from precursor pools in zebrafish, 192-204, Copyright (2007) with permission from Elsevier. Full text @ Dev. Biol.