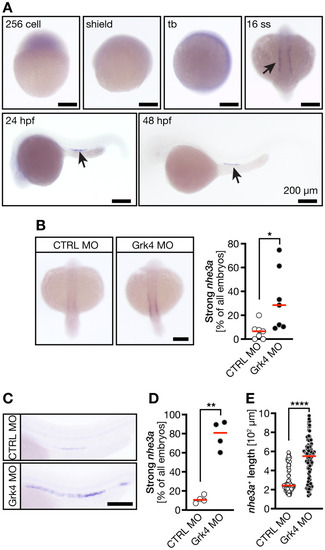
Grk4 loss-of-function results in the upregulation of nhe3a. (A) Detection of nhe3a expression during early zebrafish development using in situ hybridization. Expression (blue, indicated by arrows) can be seen in pronephric mesoderm at 16 ss and proximal tubule cells at 24 and 48 hpf. (B) At 20ss, nhe3a was more highly expressed in Grk4 morphant embryos than in the controls. Graph illustrates the percentage of embryos with strong nhe3a signals. n=7 experiments with 121-166 embryos in total. *P=0.0374 (data were analyzed using a two-tailed Welch's test). (C) Representative images illustrating nhe3a expression in control and Grk4 MO-injected embryos at 48 hpf. (D) The percentage of embryos exhibiting a strong nhe3a expression was higher in Grk4 knockdown embryos. n=4 experiments with 91-103 embryos in total. **P=0.0019 (data were analyzed using a two-tailed Welch's test). (E) Nhe3a signals can be detected over a longer region in Grk4-depleted embryos than in the controls at 48 hpf. n=4 experiments with 89-102 embryos in total. ****P<0.0001 (data were analyzed using a two-tailed Welch's test). Scale bars, 200 μm. ss, somite stage; hpf, hours post-fertilization; Grk4, G protein-coupled receptor kinase 4; CTRL, control; MO, morpholino oligonucleotide.
|