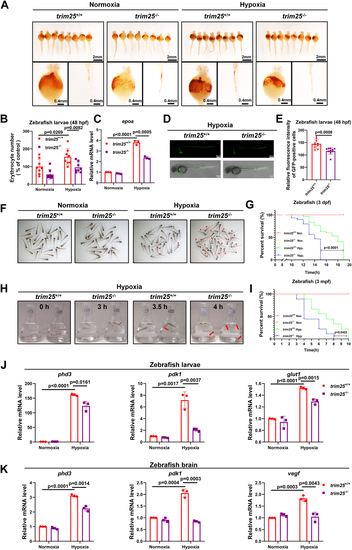
Disruption of trim25 in zebrafish attenuates hypoxia tolerance.A, O-dianisidine staining of functional hemoglobin in trim25+/+ and trim25−/− zebrafish larvae after treatment with normoxia (21% O2) or hypoxia (10% O2) for 10 h. B, the number of erythrocytes was decreased in trim25−/− zebrafish larvae compared to trim25+/+ zebrafish larvae after treatment with hypoxia (10% O2) for 10 h (n = 8 per group). C, qPCR analysis of epoa mRNA in trim25+/+ or trim25−/− zebrafish larvae (3 dpf) under hypoxia (2% O2) for 6 h. D, fluorescence images of eGFP-labeled erythrocytes in trim25+/+ and trim25−/− zebrafish larvae with Tg(gata1:eGFP) transgenic background after hypoxia (10% O2) exposure for 10 h. E, quantification of eGFP-labeled erythrocytes in (D) (n = 10 per group). F, images of trim25+/+ and trim25−/− zebrafish larvae (3 dpf, n = 30 per group) exposed to normoxia (21% O2) or hypoxia (2% O2) for 12 h. The dead larvae (marked by red arrows) showed no movement, no blood circulation, and physical degeneration. G, survival curve of trim25+/+ and trim25−/− zebrafish larvae (3 dpf, n = 30 per group) under normoxia (21% O2) or hypoxia (2% O2). H, images of trim25+/+ and trim25−/− adult zebrafish (3 mpf, n = 3 per group) treated with hypoxia (2% O2) for 0, 3, 3.5, and 4 h. Red arrows indicate dying zebrafish. I, survival curve of trim25+/+ and trim25−/− adult zebrafish (3 mpf, n = 9 per group) under normoxia (21% O2) or hypoxia (5% O2). J, qPCR analysis of phd3, pdk1, and glut1 mRNA in trim25+/+ or trim25−/− zebrafish larvae treated with normoxia (21% O2) or hypoxia (2% O2) for 6 h. K qPCR analysis of phd3, pdk1, and vegf mRNA in the brain of trim25+/+ or trim25−/− adult zebrafish (3 mpf) treated with normoxia (21% O2) or hypoxia (5% O2) for 3 h. Data in (G and I) were determined by the Kaplan-Meier method and log-rank test. Data in (B, C, E, J, and K) are shown as mean ± SD; statistical significance was determined by unpaired two-tailed Student’s t test; each point represents a technical replicate of a representative experiment from three independent experiments in (C, J, and K).
|
