FIGURE

Figure 2

ID
ZDB-FIG-260313-13
Publication
Tarahomi et al., 2025 - Transcriptomic identification and developmental mapping of nrg3b expression in zebrafish
Other Figures
All Figure Page
Back to All Figure Page
Figure 2

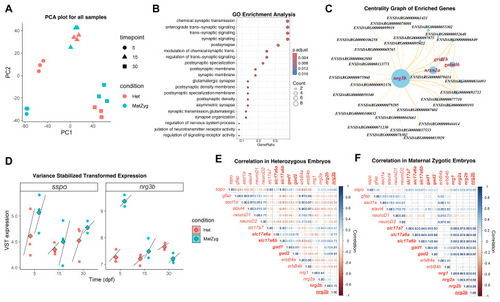
Transcriptomic prioritization of nrg3b in zebrafish. A, PCA of the variance-stabilized RNA-seq data showing clustering of samples mainly based on developmental stages (5, 15, and 30 dpf). Het: Sspo heterozygous mutant, MatZyg: Sspo maternal-zygotic mutant. B, Gene ontology enrichment analysis. C, Coexpression analysis showing high centrality of nrg3b and its connectivity to synaptic genes. D, Variance stabilizing transformation expression pathways for sspo and nrg3b developmental stages in heterozygous (brick) and maternal-zygotic (cyan) embryos. E, Correlation matrix of synaptic and neuronal markers in heterozygous embryos. F, Correlation matrix of synaptic and neuronal markers in maternal-zygotic embryos. Anticorrelation (red), positive correlation (blue).

Expression Data

Expression Detail
Antibody Labeling
Phenotype Data

Phenotype Detail
Acknowledgments
This image is the copyrighted work of the attributed author or publisher, and ZFIN has permission only to display this image to its users. Additional permissions should be obtained from the applicable author or publisher of the image. Full text @ Turk J Biol