|
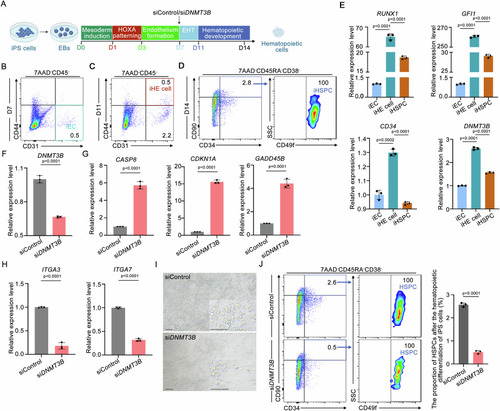
DNMT3B knockdown impairs the iHSPCs generation during hematopoietic differentiation from human iPS cells in vitro. A Schematic diagram showing hematopoietic differentiation cultures of human iPS cells. DNMT3B or control siRNA was added on day (D) 7 of EHT. B Representative FACS analysis showing the frequency of induced ECs (iECs, CD31+CD44−CD45−7AAD−) during hematopoietic differentiation on D7. C Representative FACS analysis showing the frequency of induced HE cells (iHE cells, CD31+CD44+CD45−7AAD−) during hematopoietic differentiation on D11. D Representative FACS analysis showing the frequency of induced HSPCs (iHSPCs, CD34+CD90+CD49f+CD38−CD45RA−7AAD−) during hematopoietic differentiation on D14. E qPCR analysis of the expression of hemogenic-related genes (RUNX1, GFI1, and CD34) and DNMT3B in iECs, iHE cells, and iHSPCs. F qPCR showing the expression of DNMT3B on D8 in siDNMT3B-treated Embryoid bodies (EBs) and siControl-treated EBs. G qPCR showing the expression of CASP8, CDKN1A, and GADD45B on D11 in siDNMT3B-treated iHE cells and siControl-treated iHE cells. H qPCR showing the expression of ITGA3 and ITGA7 on D11 in siDNMT3B-treated iHE cells and siControl-treated iHE cells. I Microscopy images showing fewer round hematopoietic cells generated from iPS cells in the siDNMT3B-treated group during hematopoietic differentiation on D14. J Flow cytometry analysis showing a reduced frequency of induced HSPCs (iHSPCs, CD34+CD90+CD49f+CD38−CD45RA−7AAD−) on D14. (Left) Representative flow cytometry plots. (Right) Quantification of flow cytometry analysis. Scale bars, 50 µm. Statistical significance was determined by a Two-tailed Student’s t-test. Data are presented as mean ± SD.
|