|
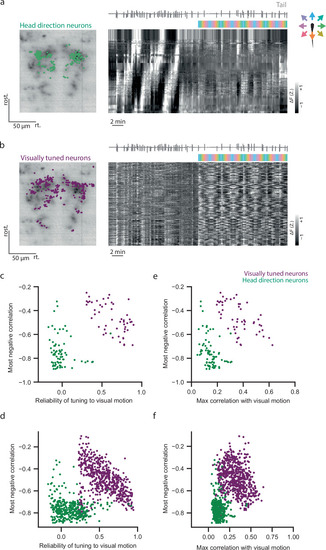
Visually tuned neurons and heading direction neurons are two separate populations in the aHB. a Left, anatomy of the aHB of a Tg(gad1b:Gal4; UAS:GCaMP6s) fish. HDNs are indicated in green. Right, traces of heading direction neurons, sorted according to their phase. The tail trace and colorful shading indicating presentation of visual motion are shown on top of the traces. b Left, anatomy of the aHB in the same fish. Visually tuned neurons are labeled in purple. Right, traces of visually tuned neurons. c Scatter plot showing the HDNs and the visually tuned neurons are functionally two separate populations (same example fish as in (a) and (b). HDNs do not show reliable responses to visual motion (x axis) and show more negative correlation values with other neurons during the darkness phase of the experiment (y axis). Heading direction neurons have more negative correlation values with other neurons during darkness and visually tuned neurons have higher values of the reliability index. d Same as c but for all fish (n(fish)=3, n(HDNs)=[74, 172, 137], n(visually tuned)=[56, 367, 236]). e Scatter plot showing the HDNs and the visually tuned neurons are functionally two separate populations (same example fish as in (a) and (b)). HDNs do not show high correlation values with visual motion, unlike visually tuned neurons. f Same as e but for all fish.
|