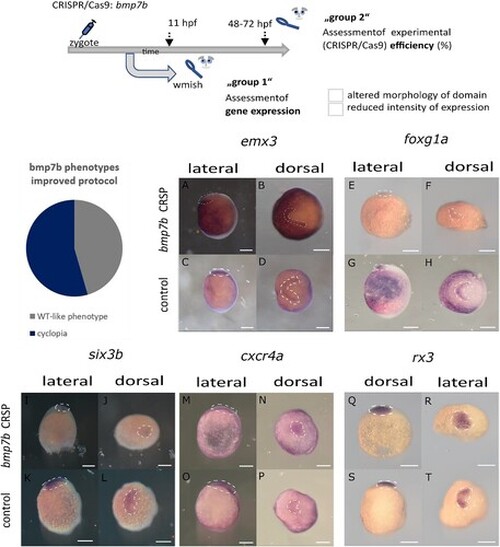
Analysis of gene expression patterns (wmish) in ANP domains in Crispants for bmp7b and controls (I) (embryos are presented in a lateral and in a dorsal view, the presumptive head is facing to the left, respectively, in dorsal views, expression domains are encircled). Scheme (top) showing the experimental procedure: CRISPR/Cas9 injections into zygotes, subsequent separation of embryos: group 1: wmish analysis, group 2: assessment of experimental efficiency (please see the Table; 5–6 uninjected embryos served as controls for each experiment). Three experiments were evaluated for the analysis of individual genes. Binary values were assigned to the Crispants: ‘normal’ vs. ‘altered’ with respect to ‘altered morphology of domain’ and ‘reduced intensity of expression’, respectively. Results are given in the Table. Pie chart shows the frequency of phenotypes in surviving embryos with the improved protocol. (A–D) show expression patterns of emx3 in controls (C, D) and Crispants (A, B). Please note the reduction of expression in the lateral domain (right) in (B). (E–H) show expression of foxg1a in controls (G, H) and Crispants (E, F). Please note the reduction of expression most seen in the lateral domain (right) in (F). (I–L) show expression of six3b in controls (K, L) and Crispants (I, J). Please note the condensed expression domain closer to the midline (J). (M–P) show expression of cxcr4a in controls (O, P) and Crispants (M, N). Please note the condensed expression domain closer to the midline (N). (Q–T) show expression of rx3 in controls (S, T) and Crispants (Q, R). Please note the condensed expression domain closer to the midline (R).
|
