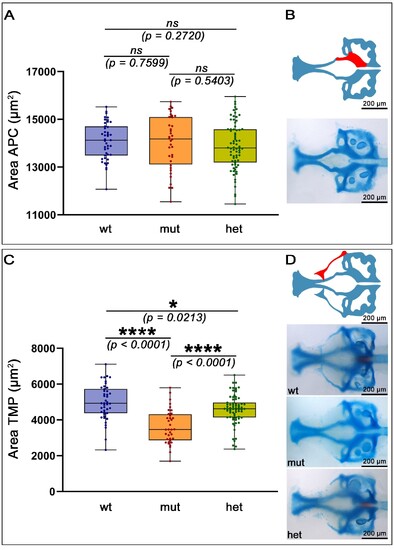
Statistical analysis of elements of the neurocranium. (A) Shown is the area of the anterior parachordals (APC) measured and statistically analysed for wild type and mutants. Statistical analysis reveals no significant differences in the area of these cartilaginous neurocranial structures between the genotypes. (B) Schematic (upper image) indicating the measured area of the basicranium (lower image). On the other hand, as shown in (C), the combined area of the triangle, taenia marginalis anterior, taenia marginalis posterior and the epiphyseal bar is of highly statistically difference between wild type and mutant genotypes. (D) Schematic (upper image) indicating the measured area of the taenia marginalis posterior in whole larval heads (lower images) All: anterior to the left, (B) Ventral view, (D) dorsal view. Abbreviations: ns, not significant; * significant; **** highly significant; wt, wildtype; mut, homozygous mutant; het, heterozygous mutant; TMP, taenia marginalis posterior. Scale bars: 200 µm.
|
