
FIGURE
Fig. 5
- ID
- ZDB-FIG-250120-49
- Publication
- Karimzadeh et al., 2024 - Fat mass and obesity associated gene and homeobox transcription factor iriquois-3 mRNA profiles in the metabolic tissues of zebrafish are modulated by feeding and food deprivation
- Other Figures
- All Figure Page
- Back to All Figure Page
Fig. 5
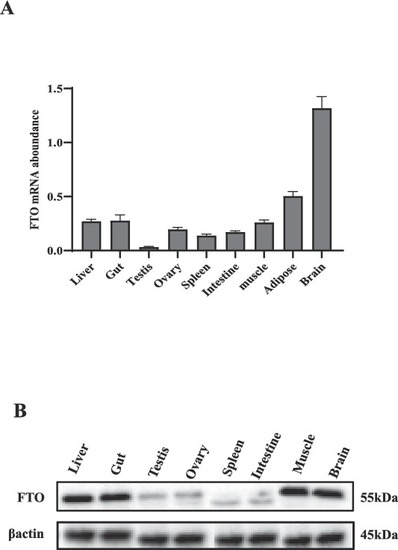
Tissue distribution of FTO. (A) FTO mRNA abundance in different tissues. (B) Western blot analysis of FTO protein in different tissues. The amount of FTO mRNA abundance was normalized to the amount of β-actin. Bars present the mean ± SEM (n = 6 zebrafish). |
Expression Data
| Gene: | |
|---|---|
| Fish: | |
| Anatomical Terms: | |
| Stage: | Adult |
Expression Detail
Antibody Labeling
Phenotype Data
Phenotype Detail
Acknowledgments
This image is the copyrighted work of the attributed author or publisher, and
ZFIN has permission only to display this image to its users.
Additional permissions should be obtained from the applicable author or publisher of the image.
Full text @ Gen. Comp. Endocrinol.