
Fig. 5
- ID
- ZDB-FIG-240916-181
- Publication
- Cömert et al., 2024 - HSP60 chaperone deficiency disrupts the mitochondrial matrix proteome and dysregulates cholesterol synthesis
- Other Figures
- All Figure Page
- Back to All Figure Page
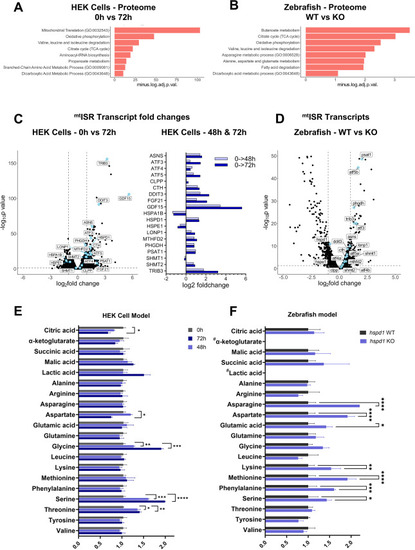
ISRmt is upregulated in D423A cells and hspd−/− larvae. (A–B) Enrichment analysis of differentially expressed proteins of D423A cells at 0 h in comparison to 72 h induced D423A cells (A) and in 5 dpf hspd1−/− larvae in comparison to hspd1+/+ larvae (B). Performed on EnrichR at gene name level for proteomics GO biological process and KEGG terms are included. The enriched terms are shown as a negative log10 of adjusted p-values. Adjusted p-values <0.05 were considered significant. (C–D) Volcano plots showing the transcriptomic regulation of mitochondrial integrated stress response (ISRmt) transcripts. ISRmt genes were taken from [ 27 ] and are displayed as blue points. (C) HEK D423A cells at 0 h in comparison to 72 h induction (left panel) and ISRmt transcript fold changes at 48 h and 72 h as compared to uninduced cells (right panel), (D) 5 dpf hspd1−/− larvae in comparison to hspd1+/+ larvae. (E–F) Amino acids and TCA cycle intermediate metabolites were analyzed by targeted metabolomics, and mean-centered abundance values were further normalized to total ion intensity. (E) In the D423A cells, significance was calculated against uninduced cells (mean ± SD, n = 3, multiple unpaired t-tests with Holm-Sidak correction). (F) 5 dpf hspd1−/− larvae in comparison to hspd1+/+ larvae (mean ± SD, n = 3, two-way ANOVA with Sidak's multiple comparisons correction). Abbreviations: GO, gene ontology; KEGG, Kyoto Encyclopedia of Genes and Genomes; See also Figure 1 , Figure 4 . |