
Fig. 1
- ID
- ZDB-FIG-240916-177
- Publication
- Cömert et al., 2024 - HSP60 chaperone deficiency disrupts the mitochondrial matrix proteome and dysregulates cholesterol synthesis
- Other Figures
- All Figure Page
- Back to All Figure Page
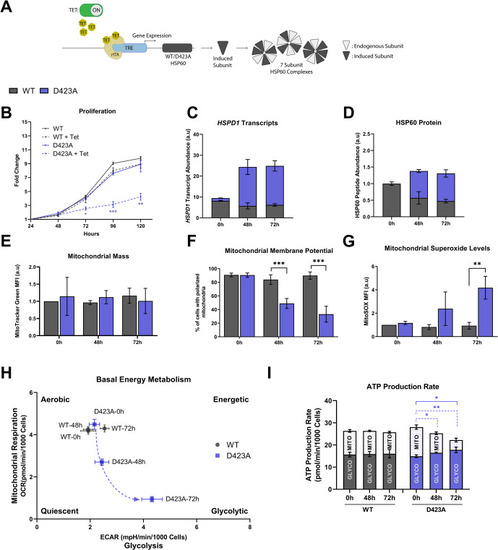
HSP60 dysfunction results in cell proliferation arrest and progressing perturbations in key mitochondrial functions. (A) Schematic representation depicting the mechanism in tetracycline-inducible HEK293 cell lines expressing wild-type HSP60 (WT) or the HSP60 dominant-negative ATPase-deficient mutant HSP60 (D423A). Inducible expressed subunits integrate with endogenously expressed subunits to form heteromeric seven-subunit HSP60 complexes. (B) Cell proliferation of WT and D423A cell lines, uninduced and induced with 50 ng/mL tetracycline for different time intervals. Represented in fold change compared to initial cell counts (statistical comparison between WT and D423A induced cell lines). (C–D) The abundance of D423A and endogenous WT HSPD1 transcript (C) and HSP60 protein (D) levels, quantified by RNA sequencing and mass spectrometry, respectively, at 0 h (uninduced), 48 h, and 72 h induced D423A cells. (E) Quantification of mitochondrial mass by MitoTracker green fluorescence in induced WT and D423A cell lines (n ≥ 3) at 0 h (uninduced), 48 h, and 72 h. (F) Percentage of cells with intact mitochondrial membrane potential in induced WT and D423A cells by JC-1 fluorescence (n ≥ 3) at 0 h (uninduced), 48 h, and 72 h induced (G) Mitochondrial superoxide levels in induced WT and D423A cells, based on MitoSOX fluorescence (n ≥ 3) at 0 h (uninduced), 48 h, and 72 h. (H) Bioenergetic profiles of induced WT and D423A cells in basal conditions, analyzed with Seahorse XFe96 analyzer at 0 h (uninduced), 48 h, and 72 h. (I) Total ATP production distinguishing the proportion of mitochondrial and glycolytic ATP production rates, analyzed using the Seahorse XFe96 analyzer at 0 h (uninduced), 48 h, and 72 h. Blue continuous line compares the total ATP production rate, and blue dashed lines compare the mitochondrial ATP production rate. Graphs represent mean ± SD (n = 3); statistical significance was determined with multiple unpaired t-tests with Holm-Sidak correction between WT and D423A induced cell lines unless otherwise stated (∗p < 0.05, ∗∗p < 0.01, ∗∗∗p < 0.001). Abbreviations: ECAR, extracellular acidification rate (represents glycolysis); FCCP, Carbonyl cyanide 4-(trifluoromethoxy) phenylhydrazone; h, hours; HEK, human embryonic kidney; HSP, heat-shock protein; OCR, oxygen consumption rate (represents oxidative phosphorylation); SD, standard deviation; TET, tetracycline; tTA, reverse tetracycline transactivator; TRE, tetracycline-responsive promoter element; WT, wild-type. |