
Fig. 2
- ID
- ZDB-FIG-240916-178
- Publication
- Cömert et al., 2024 - HSP60 chaperone deficiency disrupts the mitochondrial matrix proteome and dysregulates cholesterol synthesis
- Other Figures
- All Figure Page
- Back to All Figure Page
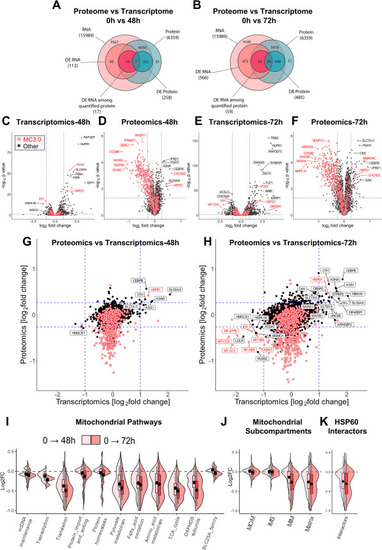
HSP60 dysfunction severely regulates the mitochondrial proteome, but not the transcriptome. (A–B) Venn diagrams representing the number of quantified and differentially expressed genes in transcriptomics and proteomics. D423A cells at 0 h were compared to 48 h (A) or 72 h induced D423A cells (B). The pairing of quantified genes of transcriptomics and proteomics was performed through Ensembl gene IDs. (C-F) Volcano plots showing the comparison of induced D423A cells at 48 h and 72 h with 0 h for quantified transcriptome (C, E), and proteome (D, F). Cut-off values are indicated with dashed lines. As indicated in Figure 2 C, Mitochondrial proteins based on MitoCarta3.0 (MC3.0; [ 2 ]) are highlighted with red points. (G, H) Comparison plot of log2fold changes of Proteomics versus Transcriptomics at 48 h (G) and 72 h (H). Cut-off values are indicated with dashed lines. Mitochondrial proteins are highlighted in red. Genes significantly up- or down-regulated at both transcript and protein levels are labeled. (I-K) Violin plots distinguishing proteins from major mitochondrial pathways (I), mitochondrial sub-compartments (J), and HSP60 interactors (K), Induced D423A cells at 0 h in comparison to 48 h (light red) or 72 h induced D423A cells (dark red), respectively. The violin plots reflect all quantitated proteins in the respective pathways, compartments, and groups; violin widths are kept constant in the plots. Cut off values for transcriptomics: Benjamini-Hochberg adjusted p-value <0.05 and |log2FC|>1. Cut off values for proteomics: p-value <0.05 and |log2FC|>0.26 Abbreviations: DE, differentially expressed; FC, fold change; IMS, intermembrane space; MIM, mitochondrial inner membrane; MOM, mitochondrial outer membrane (See also the legend of Figure 1 ). |