
Fig. 4
- ID
- ZDB-FIG-240904-23
- Publication
- Ma et al., 2024 - Instantaneous visual genotyping and facile site-specific transgenesis via CRISPR-Cas9 and phiC31 integrase
- Other Figures
- All Figure Page
- Back to All Figure Page
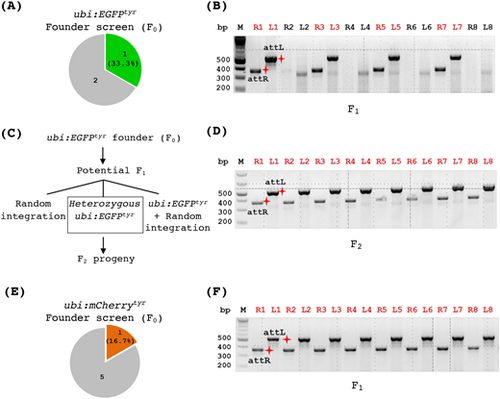
Generation of allele-tracking reporter lines for the tyr mutation. (A,B) Founder screen results of the transgenic ubi:EGFPtyr zebrafish. (A) A pie chart indicating the number of F0 fish screened that produced some fluorescent embryos (the green piece) or all non-fluorescent embryos (the gray piece). (B) PCR analysis of individual fluorescent F1 embryos demonstrating that some of them (labeled by red numbers on top) carried a correct ubi:EGFP integration. ‘R’ and ‘L’ in front of the numbers on top indicate attR and attL PCR, respectively. The red shining star symbols mark the correct size products of attR (369 bps) and attL (534 bps). (C) Schematic depicting potential genotypes of the descendants from an ubi:EGFPtyr founder fish. (D) PCR analysis of individual fluorescent embryos (F2) from a heterozygous ubi:EGFPtyr fish (F1) indicating that all of them carried the correct integration. (E,F) Founder screen results of the transgenic ubi:mCherrytyrzebrafish. (E) A pie chart indicating the number of F0 fish screened that produced some fluorescent embryos (the red piece) or all non-fluorescent embryos (the gray piece). (F) PCR analysis of individual fluorescent F1 embryos showing that all of them carried a correct ubi:mCherry integration. |