
Fig. 5
- ID
- ZDB-FIG-240314-22
- Publication
- Narayanan et al., 2024 - Predictive neural computations in the cerebellum contribute to motor planning and faster behavioral responses in larval zebrafish
- Other Figures
- All Figure Page
- Back to All Figure Page
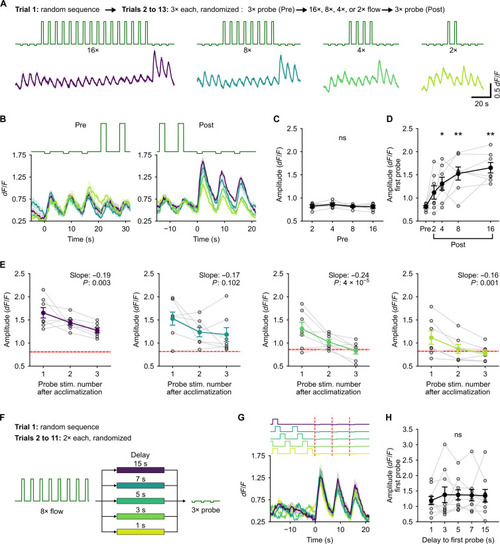
Purkinje cell (PC) response to probe represents the magnitude of error from the expected stimulus pattern. (A) Top (text): Description of the experimental protocol. Middle: Stimulus traces. Bottom: Corresponding calcium responses in backward-tuned cells. Solid line is the mean for N = 7 fish, and shaded regions are SEM. Colors indicate the number of acclimatization pulses. (B) Zoomed-in view of the average calcium response of backward-tuned cells to pre-probe (left) and post-probe (right) pulses aligned to the onset of the first probe. (C) Average amplitude of the response to pre-probe stimuli. ns, P = 0.54. The three probe pulses were pooled as there was no difference between them. (D) Average amplitude of the response to the first post-probe pulse scales with the number of acclimatization pulses. P = 0.0015 by Friedman’s test; *P < 0.05 and **P < 0.01 by post hoc Conover’s test w.r.t. the pre-probe amplitude. (E) Decay of the amplitude of the enhanced response to the post-probe stimulus over the three successive post-probe pulses for the different number of acclimatization pulses. Red dashed line with the shaded region shows the mean and SEM of the respective pre-probe amplitudes. Slope and P value by linear mixed-effects are inset in each plot. (F) Schematic of the experimental protocol for the delayed probe experiments. 3× probe pulses were presented with a variable delay from 1 s to 15 s after 8× acclimatization pulses. (G) Average response of the backward-tuned cells aligned to the onset of the probe pulses. Shaded regions are SEM across N = 9 fish. Colors indicate the delay as shown in (F). (H) Amplitude of the response to the first probe pulse does not depend on the delay. ns, P = 0.98 by Friedman’s test. |