
Fig. 2
- ID
- ZDB-FIG-240314-19
- Publication
- Narayanan et al., 2024 - Predictive neural computations in the cerebellum contribute to motor planning and faster behavioral responses in larval zebrafish
- Other Figures
- All Figure Page
- Back to All Figure Page
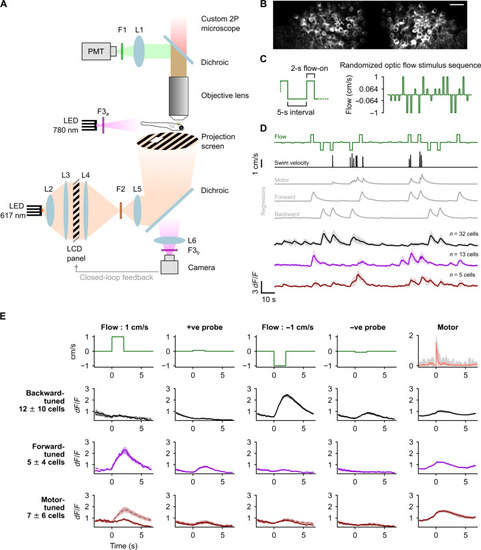
Purkinje cells (PCs) show direction selective responses to optic flow stimuli. (A) Schematic of the experimental setup. (B) Average two-photon image of PCs expressing GCaMP6s from a representative fish. Scale bar, 20 μm (C) Left: Zoomed-in view of the stimulus protocol highlighting the 5-s interval between two stimulus pulses and the 2-s pulse duration. Right: An example of the randomly ordered optic flow stimulus presented in the first trial. Note: The y axis is scaled nonlinearly in this schematic to highlight the small-amplitude probe stimuli. (D) Classification of PCs based on tuning as backward (black), forward (magenta), or motor (brown) using regressors (gray) in a representative fish, shown as means ± SD. (E) Average response profiles across fish of backward-, forward-, and motor-tuned cells (rows 2, 3, and 4, respectively) aligned to the start of each stimulus (columns 1 to 4) or motor activity (column 5); shaded regions around the average calcium traces are SEM over N = 8 fish. The first row shows the respective optic flow stimulus (columns 1 to 4) and average motor activity (column 5). Solid lines in columns 1 to 4 are average responses for stimulus presentations without motor activity, and the dashed lines are averages for all presentations including those with motor activity. Motor activity traces in gray represent the average for individual fish. |