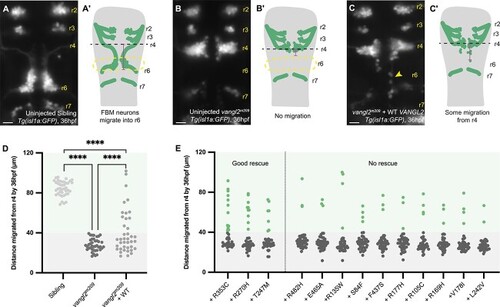
Motor neuron migration cannot be rescued by most VANGL2 variants. (A–A′) Representative hindbrain of uninjected Tg(isl1a:GFP) sibling at 36 hpf (A), motor neurons have migrated from rhombomere 4 (r4) into rhombomere 6 (r6). Measurement of migration distance (magenta line) from r4 (black line) schematized in (A′). (B–B′) Representative hindbrain of vangl2m209; Tg(isl1a:GFP) homozygous mutant at 36 hpf (B), motor neurons have failed to migrate from r4 into r6. Measurement of migration distance schematized in (B′). (C–C′) Representative hindbrain of vangl2m209; Tg(isl1a:GFP) homozygous mutant at 36 hpf injected with WT VANGL2 mRNA at 1-cell stage, some neurons exit r4 (arrowhead). Measurement of migration distance schematized in (C′). (D) Representation of Isl1a + neuron phenotype by migration distance from r4 at 36 hpf. Each dot denotes a single embryo. Colour-coded regions defined by uninjected homozygous vangl2m209 mutant data range: within/no rescue is grey, above/rescue is green. In homozygous vangl2m209 mutant embryos injected with WT VANGL2 mRNA, migration distance above the mutant range is defined as “rescue”. p-values represent Fisher’s exact test based on rescue and mutant categories for each group. WT VANGL2 mRNA injection partially rescues neuronal migration (see Supplementary Table 3 for statistical tests). (E) Representation of Isl1a + neuron phenotype by migration distance from r4 at 36 hpf in homozygous vangl2m209 mutants injected with mRNA encoding different VANGL2 VUS. Each dot denotes a single embryo, colour coded regions and dots denote comparison against the threshold of uninjected homozygous mutant data from panel D. Variants are ranked and grouped based on result of Fisher’s exact test when comparing rescue and mutant categories to uninjected homozygous vangl2m209 mutants and homozygous vangl2m209 mutants injected with WT VANGL2 mRNA (see Supplementary Table 4 for statistical tests). A–C: dorsal views, anterior up. D-E: Fisher’s exact tests, ****: p < 0.0001. Scale bars: 20 μm.
|
