FIGURE

Fig. 2

ID
ZDB-FIG-231221-26
Publication
Campbell et al., 2023 - Mitochondrial proteins encoded by the 22q11.2 neurodevelopmental locus regulate neural stem and progenitor cell proliferation
Other Figures
All Figure Page
Back to All Figure Page
Fig. 2

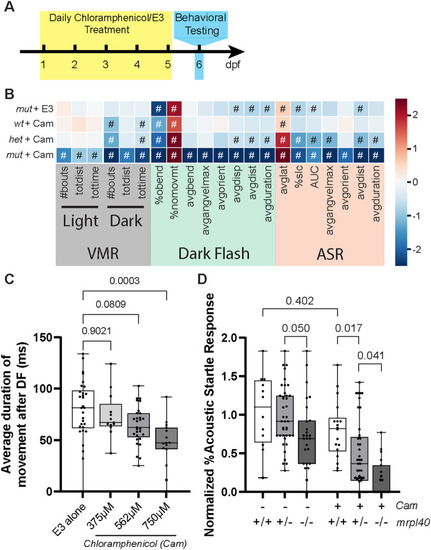
Pharmacologic inhibition of mitochondrial function phenocopies the mrpl40 mutant phenotype

A Chloramphenicol experimental setup. Animals were treated daily with chloramphenicol in E3 or with E3 alone and then behaviorally tested at 6dpf. B Heatmap illustrating behavioral phenotype across VMR, DF, and ASR behavioral metrics based on mrpl40 genotype and Chloramphenicol (Cam) treatment status. mut+E3 (n = 27), wt+Cam (n = 18), het+Cam (n = 41), mut+Cam (n = 19) from two biological replicates. Values that are significantly different from sibling/untreated controls based on Student’s t test with a p-value of <0.05 are designated with #. See Fig. 1 legend for full description of heatmap. C Chloramphenicol-treated larvae have dose-dependent reductions in the average duration of movement following DF stimuli. E3 alone (n = 30), 375 μM (n = 13), 562 μM (n = 29), 750 μM (n = 15) from three biological replicates. One-way ANOVA, p-values are displayed on the plot. D Percent Acoustic Startle Response based on mrpl40 genotype and Cam treatment status. mrpl40 heterozygotes and mutants are hypersensitive to Cam-treatment. Wildtypes (n = 12), hetererozygotes (n = 40), mutants (n = 27) with E3. Wildtypes (n = 18), hetererozygotes (n = 41), mutants (n = 19) with Chloramphenicol 562 μM from two biological replicates.. One-way ANOVA, p-values are displayed on the plot.

Expression Data

Expression Detail
Antibody Labeling
Phenotype Data

Phenotype Detail
Acknowledgments
This image is the copyrighted work of the attributed author or publisher, and ZFIN has permission only to display this image to its users. Additional permissions should be obtained from the applicable author or publisher of the image. Full text @ Mol. Psychiatry