|
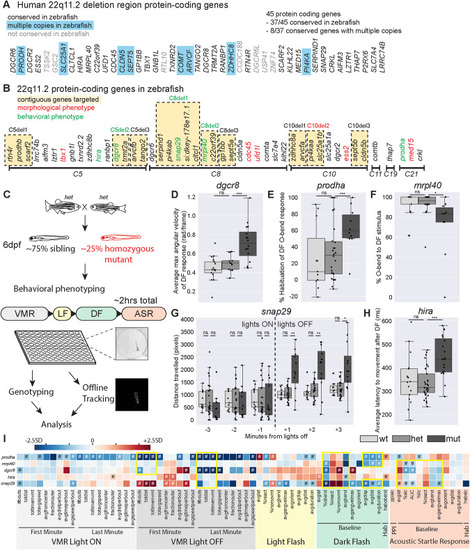
Mutants in five genes including two encoding mitochondrial proteins, display partially overlapping behavioral phenotypes. A Protein-coding genes present in the usual 3Mb human deletion. Those without orthologs in zebrafish are shaded gray. Those with multiple copies in zebrafish are highlighted in blue. B Zebrafish 22q11.2 orthologs are on six different chromosomes. Contiguous genes that were targeted for combination deletion are highlighted in yellow. Single or combination gene mutants with morphological or behavioral phenotypes are shown in red and green font respectively. C Behavioral phenotyping paradigm. Heterozygous carriers are in-crossed to generate homozygous mutants and siblings that are raised to 6dpf at which point behavioral phenotyping is performed blinded to genotype. Approximately 50 larvae are used for each mutant line, and arrayed in a 100-well plate. Assay occurs over approximately 2 h in the following order: Visual-motor Response (VMR), Light Flash (LF), Dark Flash (DF), Acoustic Startle Response (ASR). Individual larvae are genotyped, acquired videos are tracked offline, and then analyzed for 94 behavioral metrics. D–H Example phenotypes for five single gene mutants with reproducible behavioral phenotypes. Each plot represents data from a single behavioral run. Points indicate individual larvae, Boxes indicate range of 25th to 75th percentile with line indicating the median, whiskers indicate the rest of the range, with outliers lying outside of this. D Average maximum angular velocity of the DF response is increased in dgcr8 mutants compared to siblings. E Percent habituation of DF O-bend response is increased in prodha mutants compared to siblings. F Percent of time mrpl40 mutants perform O-bends in response to DF is decreased compared to siblings. Gsnap29 mutants display an increase in distance traveled in VMR assay following lights turning off compared to siblings. Each bin represents the total distance traveled in during that minute of the assay. H Average latency to movement after DF stimulus is increased in hira mutants compared to siblings. All statistics represent one-way ANOVA, *p < 0.05, **p < 0.01, ***p < 0.001. I Heatmap illustrating single gene mutant phenotypes across behavioral metrics. Each row is an individual mutant line and all columns represent a behavioral metric. Color of each box represents difference of average mutant value compared to siblings expressed as number of standard deviations (SD). Blue boxes indicate the value is lower in the mutant and Red boxes indicate the value is higher in the mutant. Mutant values that are significantly different from siblings based on Student’s t test with a Bonferroni-corrected p-value of <0.05/94 are designated with #. Yellow boxes indicate behavioral similarities across mutant lines. VMR behavioral metrics are highlighted in gray, LF in yellow, DF in green, and ASR in orange. Supplementary Tables 5–7 display behavioral data and sample sizes for mutant lines with reproducible behavioral phenotypes. Python tracking scripts are in Supplementary Zip file 1.
|