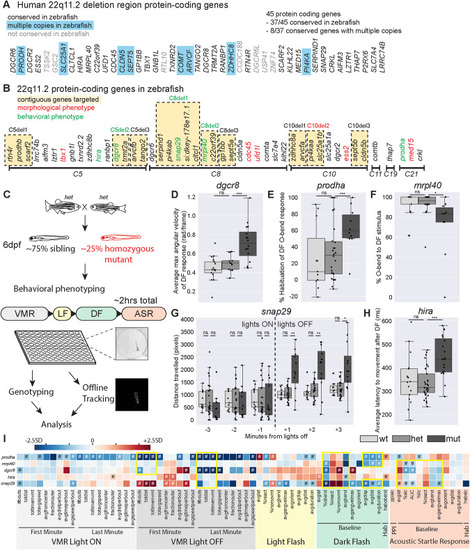
Mutants in five genes including two encoding mitochondrial proteins, display partially overlapping behavioral phenotypes.

A Protein-coding genes present in the usual 3Mb human deletion. Those without orthologs in zebrafish are shaded gray. Those with multiple copies in zebrafish are highlighted in blue. B Zebrafish 22q11.2 orthologs are on six different chromosomes. Contiguous genes that were targeted for combination deletion are highlighted in yellow. Single or combination gene mutants with morphological or behavioral phenotypes are shown in red and green font respectively. C Behavioral phenotyping paradigm. Heterozygous carriers are in-crossed to generate homozygous mutants and siblings that are raised to 6dpf at which point behavioral phenotyping is performed blinded to genotype. Approximately 50 larvae are used for each mutant line, and arrayed in a 100-well plate. Assay occurs over approximately 2 h in the following order: Visual-motor Response (VMR), Light Flash (LF), Dark Flash (DF), Acoustic Startle Response (ASR). Individual larvae are genotyped, acquired videos are tracked offline, and then analyzed for 94 behavioral metrics. DH Example phenotypes for five single gene mutants with reproducible behavioral phenotypes. Each plot represents data from a single behavioral run. Points indicate individual larvae, Boxes indicate range of 25th to 75th percentile with line indicating the median, whiskers indicate the rest of the range, with outliers lying outside of this. D Average maximum angular velocity of the DF response is increased in dgcr8 mutants compared to siblings. E Percent habituation of DF O-bend response is increased in prodha mutants compared to siblings. F Percent of time mrpl40 mutants perform O-bends in response to DF is decreased compared to siblings. Gsnap29 mutants display an increase in distance traveled in VMR assay following lights turning off compared to siblings. Each bin represents the total distance traveled in during that minute of the assay. H Average latency to movement after DF stimulus is increased in hira mutants compared to siblings. All statistics represent one-way ANOVA, *p < 0.05, **p < 0.01, ***p < 0.001. I Heatmap illustrating single gene mutant phenotypes across behavioral metrics. Each row is an individual mutant line and all columns represent a behavioral metric. Color of each box represents difference of average mutant value compared to siblings expressed as number of standard deviations (SD). Blue boxes indicate the value is lower in the mutant and Red boxes indicate the value is higher in the mutant. Mutant values that are significantly different from siblings based on Student’s t test with a Bonferroni-corrected p-value of <0.05/94 are designated with #. Yellow boxes indicate behavioral similarities across mutant lines. VMR behavioral metrics are highlighted in gray, LF in yellow, DF in green, and ASR in orange. Supplementary Tables 57 display behavioral data and sample sizes for mutant lines with reproducible behavioral phenotypes. Python tracking scripts are in Supplementary Zip file 1.

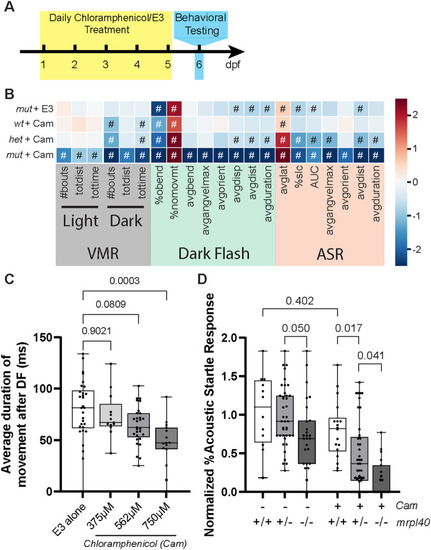
Pharmacologic inhibition of mitochondrial function phenocopies the mrpl40 mutant phenotype

A Chloramphenicol experimental setup. Animals were treated daily with chloramphenicol in E3 or with E3 alone and then behaviorally tested at 6dpf. B Heatmap illustrating behavioral phenotype across VMR, DF, and ASR behavioral metrics based on mrpl40 genotype and Chloramphenicol (Cam) treatment status. mut+E3 (n = 27), wt+Cam (n = 18), het+Cam (n = 41), mut+Cam (n = 19) from two biological replicates. Values that are significantly different from sibling/untreated controls based on Student’s t test with a p-value of <0.05 are designated with #. See Fig. 1 legend for full description of heatmap. C Chloramphenicol-treated larvae have dose-dependent reductions in the average duration of movement following DF stimuli. E3 alone (n = 30), 375 μM (n = 13), 562 μM (n = 29), 750 μM (n = 15) from three biological replicates. One-way ANOVA, p-values are displayed on the plot. D Percent Acoustic Startle Response based on mrpl40 genotype and Cam treatment status. mrpl40 heterozygotes and mutants are hypersensitive to Cam-treatment. Wildtypes (n = 12), hetererozygotes (n = 40), mutants (n = 27) with E3. Wildtypes (n = 18), hetererozygotes (n = 41), mutants (n = 19) with Chloramphenicol 562 μM from two biological replicates.. One-way ANOVA, p-values are displayed on the plot.

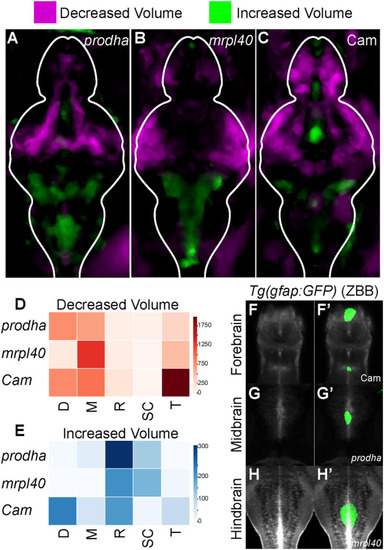
Mitochondrial disruption leads to alterations in brain volume.

AC Differences in brain volume in mitochondrial mutants and pharmacologically inhibited larvae. Deformation-based morphometry for prodha mutants (A), mrpl40 mutants (B), and Chloramphenicol-treated (C) larvae shows differences in multiple brain areas. Images are sum projections of whole-brain z-stacks. Magenta designates areas that are reduced in volume compared to siblings/controls and Green designates areas that are increased in volume compared to siblings/controls. White outline indicates outline of brain. Analysis performed as in Thyme et al. [35]. Representative images of two biological replicates with at least n = 11 wildtypes/controls and n = 12 mutants/treated. DE Heatmaps illustrating degree to which volume signals in AC occupy various brain regions in arbitrary units. Higher values indicate larger reductions (D)/increases (E) in volume in designated region. Values are scaled based on size of the region as performed in Randlett et al. [36]. D diencephalon, M mesencephalon, R rhombencephalon, SC spinal cord, T telencephalon. FH’ Colocalization of increases in brain volume with gfap reporter line. Average signal of a Tg(gfap:GFP) line that has been registered to the Zebrafish Brain Browser (ZBB) atlas was merged with increased volume signals for prodha mutants (G-G’), mrpl40 mutants (H-H’), and Chloramphenicol-treated (F-F’) larvae. Increased volume colocalizes with GFP signal in multiple brain regions in the ventricle-occupying midline.

prodha mutant NSPCs in the central proliferative zone are expanded and hyperproliferative.

A Diagram depicting NSPC populations in the zebrafish hindbrain at 5dpf. Transverse plane view shows highly proliferative NSPCs (Sox2+/Glast−) and committed progenitors/neuroblasts (Sox−/Glast−) located dorsally (Dorsal proliferative zone inset) and less proliferative NSPCs (Sox2+/Glast+) located centrally (Central proliferative zone inset). Insets are horizontal plane view. BD Sox2 antibody staining (B) and Tg(slc1a3b:H2AmCherry) labeling (C) in central proliferative zone in wildtypes, mrpl40 mutants, and prodha mutants. Wildtypes and mrpl40 mutants display similar patterns whereas prodha mutants have an expanded Sox2+ and Glast+ domain. Images are single confocal slices. Scale bars 10 μm. Quantification shows increased number of Glast+ cells in prodha mutants (D). Unpaired two-way Student’s t test, p-values are displayed on the plots. mrpl40 mutants (n = 9) and siblings (n = 9). prodha mutants (n = 10) and siblings (n = 12) from two biological replicates. E, F PH3 staining in central proliferative zone in siblings, mrpl40 mutants, and prodha mutants. prodha mutants show an increased number of Glast+/PH3+ cells compared to siblings (F). Unpaired two-way Student’s t test, p-values displayed on the plots. Images are maximum projections from confocal stacks. Scale bars 10 μm. mrpl40 mutants (n = 19) and siblings (n = 25). prodha mutants (n = 25) and siblings (n = 26) from four biological replicates.

mrpl40 mutants have fewer NSPCs and a reduction in NSPC proliferation in the dorsal proliferative zone.

AD PCNA and DAPI antibody staining in wildtypes (A), mrpl40 mutants (B), and prodha mutants (C) in dorsal proliferative zone. mrpl40 mutants have fewer PCNA+ cells than wildtypes. prodha mutants have similar numbers to wildtypes. Quantification in D. One-way ANOVA, p-values are displayed on the plots. Siblings (n = 21), mrpl40 mutants (n = 10), prodha mutants (n = 13) form two biological replicates. Both mrpl40 and prodha mutants appear to have increased ventricle size (yellow arrows). Images are single confocal slices. Scale bars 15 μm. E PH3 staining in dorsal proliferative zone in siblings, mrpl40 mutants, and prodha mutants.. mrpl40 mutants show a decrease in the number of Glast−/PH3+ cells compared to siblings. Unpaired two-way Student’s t test, p-values displayed on the plots. mrpl40 mutants (n = 19) and siblings (n = 25). prodha mutants (n = 25) and siblings (n = 26) from four biological replicates. FH Sox2/PCNA antibody staining in wildtypes (E) and mrpl40 mutants (F) in dorsal proliferative zone. mrpl40 mutants show a reduction in the number of Sox2−/PCNA+ cells but no difference in the number of Sox2+/PCNA+ cells (G). Quantification in G. Unpaired two-way Student’s t test, p-values displayed on the plot. mrpl40 mutants (n = 10) and siblings (n = 12) from three biological replicates. Images are single confocal slices. Dotted line indicates boundary of Sox2+ cells. Scale bars 15 μm. IJ Proliferative cells in dorsal hindbrain of mrpl40 mutants (I) display elongated nuclei compared to wildtypes (H). Images are single confocal slices. Scale bars 10 μm. KM PH3/PCNA antibody staining in wildtypes (J) and mrpl40 mutants (K) in dorsal proliferative zone. mrpl40 mutants show a reduction in the number of PH3+ cells located both centrally along ventricle and more peripherally. Quantification in L. Unpaired two-way Student’s t tests, p-values displayed on the plot. mrpl40 mutants (n = 14) and siblings (n = 15) from three biological replicates. Images are maximum projections from confocal stacks. Scale bars 20 μm.

mrpl40 and prodha function independently from each other to regulate NSPC proliferation.

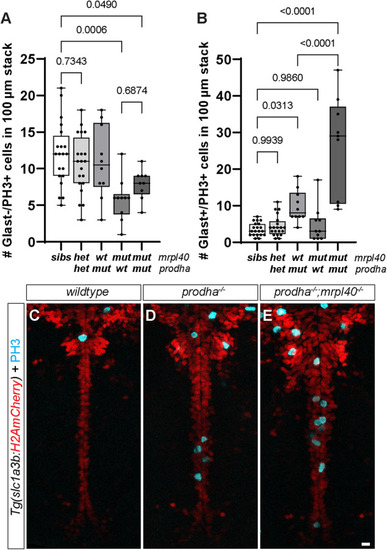
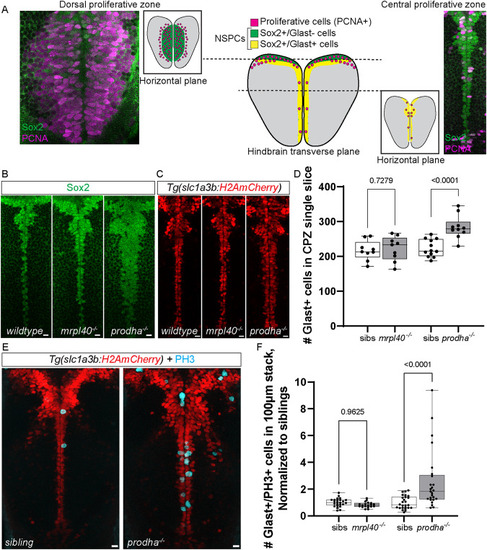
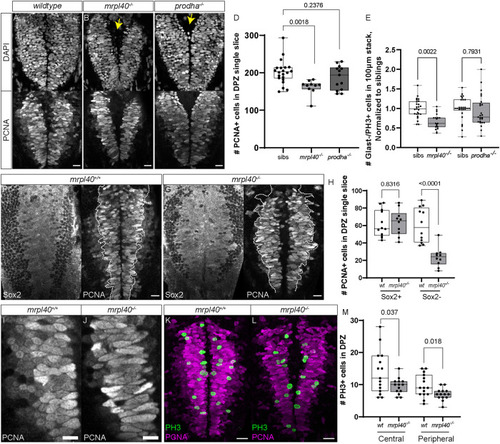
Number of Glast−/PH3+ (A) and Glast+/PH3+ (B) cells in mrpl40/prodha transheterozygotes and double mutants compared to single mutants. Double mutants have both prodha and mrpl40 single mutant phenotypes. Transheterozygotes display no phenotypes. Quantification one-way ANOVA, p-values are displayed on the plots. siblings (n = 20), transheterozygotes (n = 20), mrpl40 mutants (n = 10), prodha mutants (n = 10) and mrpl40;prodha double mutants (n = 9) from four biological replicates. PH3 staining in Tg(slc1a3b:H2AmCherry) line in wildtype (C), single prodha mutants (D), and double mutants (E). Double mutant has more severe hyperproliferative phenotype, revealing role for mrpl40 in Glast+ NSPCs.

Acknowledgments
This image is the copyrighted work of the attributed author or publisher, and ZFIN has permission only to display this image to its users. Additional permissions should be obtained from the applicable author or publisher of the image. Full text @ Mol. Psychiatry