|
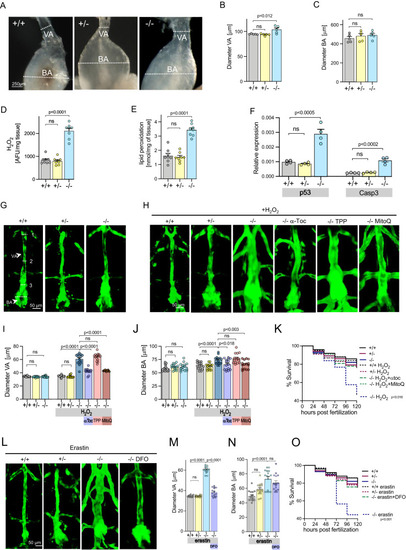
Aortic abnormalities in Secisbp2 mutant zebrafish. A Representative aortic outflow tract images, comprising ventral aorta (VA) and bulbus arteriosus (BA), from wild-type (Secisbp2wt/wt; +/+), heterozygous (Secisbp2Q333X/wt; +/−) and homozygous (Secisbp2Q333X/Q333X; −/−) mutant adult (age 6 months) zebrafish. The dotted lines show the positions of VA and BA measurements quantified in (B and C). Each image was repeated independently 5 times with similar results. Scale bar: 250 μm. B and C VA and BA diameters, adjusted for body size, measured at dotted line positions in (A), in wild-type (+/+: grey bar), heterozygous (+/−: yellow bar) and homozygous (−/−: blue bar) Secisbp2 mutant fish. Statistics: Unpaired, two-tailed t-test, each bar represents the mean (n = 5), and error bars represent SD. D–F H2O2 (D, n = 8), lipid peroxidation (E, n = 8) and p53/casp3 mRNA expression (F, n = 4) in VA/BA tissue from wild type (+/+: grey bar), heterozygous (+/−: yellow bar) and homozygous (−/−: blue bar) Secisbp2 mutant fish. Statistics: unpaired, two-tailed t-test, each bar represents the mean, and error bars represent SD. G, H and L. Representative images, of the ventral aorta (VA) and bulbus arteriosus (BA) from wild-type (Secisbp2wt/wt; +/+), heterozygous (Secisbp2Q333X/wt; +/−) and homozygous (Secisbp2Q333X/Q333X; −/−) zebrafish embryos at 5 dpf. Images show vascular endothelial cell-specific green fluorescent protein, VA diameter and BA diameter was measured at positions (1–3) marked with broken line (G, +/+). Zygotes were treated (from 3 to 120 hpf) with 0.5 mM H2O2 or H2O2 + 1 mM α-tocopherol (αToc) or H2O2 + 1 mM Decyltriphenylphosphonium (TPP) or H2O2 + 1 mM MitoQ (H) or treated (from 6 to 120 hpf) with 10 mM Erastin or 10 mM Erastin + 100 mM desferrioxamine (DFO) (L). Each image was acquired independently fifteen times, with similar results. Scale bars: 250 μm. I and J Mean VA diameter, measured at positions (1–3) marked in (A) (I), or BA diameter (J) quantified in different groups (5 dpf, n = 15) in wild-type (Secisbp2wt/wt; +/+), heterozygous (Secisbp2Q333X/wt; +/−), homozygous (Secisbp2Q333X/Q333X; −/−) fish, untreated or treated with 0.5 mM H2O2 in combination with 1 mM α-tocopherol (αToc) or 1 mM Decyltriphenylphosphonium (TPP) or 1 mM MitoQ. Statistics: unpaired, two-tailed t-test, each bar represents the mean and error bars represent SD. K Percent survival of embryos over time in different groups described in (G–J). Statistics: Logrank test for trend (Chi-square), p-value for H2O2 treated Secisbp2Q333X/Q333X (−/−) versus all comparisons, each line represents the % of surviving fish (n = 100–200). M and N Mean VA diameter, measured at positions (1–3) marked in (A) (M), or BA diameter (N) quantified in different groups (5 dpf, n = 15) in wild-type (Secisbp2wt/wt; +/+), heterozygous (Secisbp2Q333X/wt; +/−), homozygous (Secisbp2Q333X/Q333X; −/−) fish, all treated with 10 mM Erastin or with 10 mM Erastin + 100 mM desferrioxamine (DFO). Statistics: unpaired, two-tailed t-test, each bar represents the mean, error bars represent SD. O Percent survival of embryos over time in different groups described in (L–I). Statistics: Logrank test for trend (Chi-square), the p-value for elastin-treated Secisbp2Q333X/Q333X (−/−) versus all comparisons, each line represents the percentage of surviving fish (n = 100–200). Source data are provided as a Source Data file.
|