
- Title
-
Selenoprotein deficiency disorder predisposes to aortic aneurysm formation
- Authors
- Schoenmakers, E., Marelli, F., Jørgensen, H.F., Visser, W.E., Moran, C., Groeneweg, S., Avalos, C., Jurgens, S.J., Figg, N., Finigan, A., Wali, N., Agostini, M., Wardle-Jones, H., Lyons, G., Rusk, R., Gopalan, D., Twiss, P., Visser, J.J., Goddard, M., Nashef, S.A.M., Heijmen, R., Clift, P., Sinha, S., Pirruccello, J.P., Ellinor, P.T., Busch-Nentwich, E.M., Ramirez-Solis, R., Murphy, M.P., Persani, L., Bennett, M., Chatterjee, K.
- Source
- Full text @ Nat. Commun.
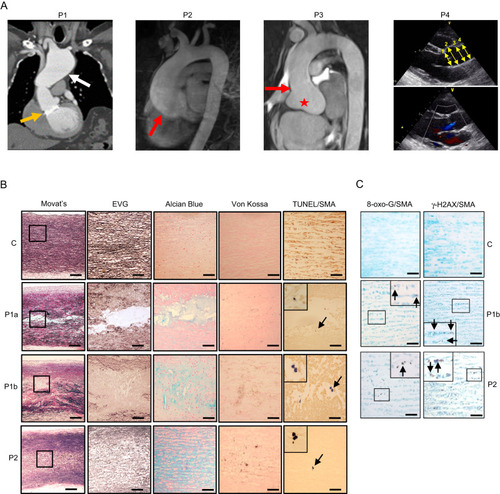
Thoracic aortic aneurysms with cystic medial necrosis. |
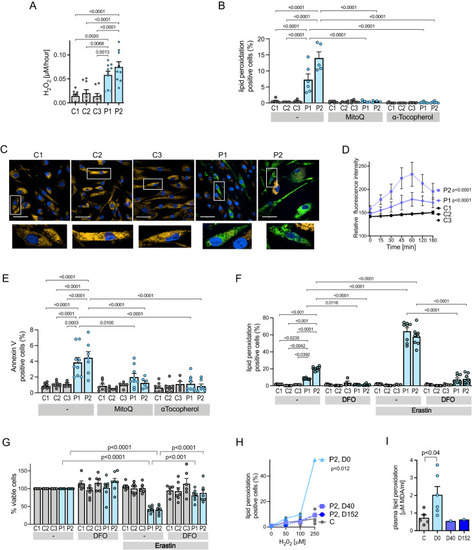
Increased oxidative stress, apoptosis and susceptibility to ferroptosis in aortic vascular smooth muscle cells. |
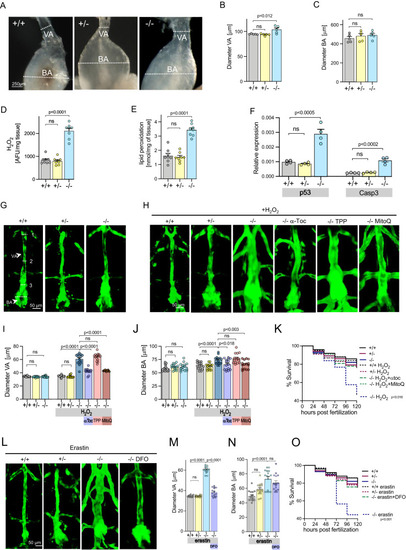
Aortic abnormalities in |

Aortic abnormalities in |
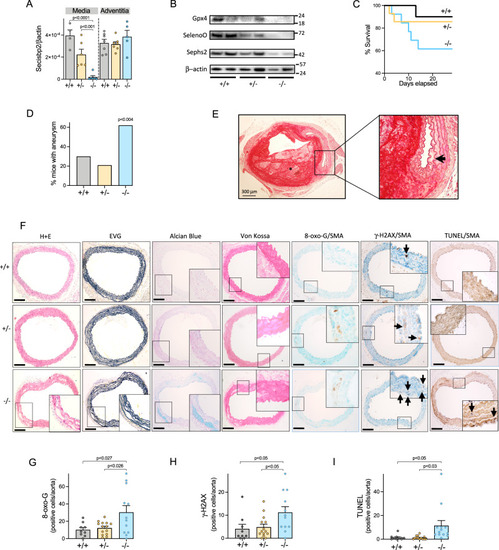
Thoracic aortic aneurysms in VSMC-targeted, |