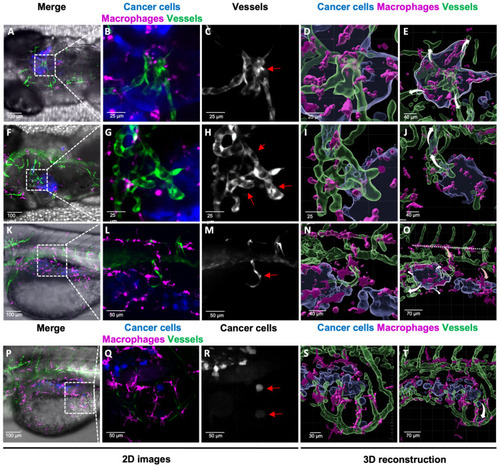
Analysis of 3D TME reconstruction and vessel dynamics: a predictive tool for tumour fate. (A–T) Each cell population is highlighted with a coded colour; cancer cells in blue or white, macrophages in magenta or white and vessels in green or white as shown in the images. The arrows in 3D reconstructions represent the prediction of tumour fate (white arrow) and macrophage fate (light-red arrow). (A–E) Z-stack projection (A–C) and reconstruction (D,E) of the glioblastoma TME live imaging 48 h after transplantation (B–D). The images show vessel dilatation in the centre of the tumour mass (C, red arrow). (E) The white arrow in the 3D reconstruction represents the prediction of tumour growth. (F–J) Z-stack projection (F–H) and reconstruction (I,J) of the glioblastoma TME live imaging 48 h after transplantation. Images represent a Z projection (Z = 30 slices) of the TME. (H) Vessel angiogenesis in contact with the tumour mass (red arrow). (I,J). A 3D reconstruction showing cancer cells migration through the vessels in the upper left corner. (J) The white arrow represents the predicted route of cancer dissemination regarding vessel localization. (K–O) Z-stack projection (K–M) and reconstruction (N,O) of the melanoma TME live imaging 24 h after transplantation. Images represent a Z projection (Z = 74 slices) of the TME. (L,M) Neo-angiogenesis is shown with a new vessel redirected inside the tumour mass (red arrow). (N) Macrophages are recruited at the tumour site following the new growing vessel. (O) The horizontal dashed line represents macrophages orientation outside the tumour site. The light-red arrows represent the orientation of the macrophage migration. The white arrows represent the predicted route of cancer cell dissemination regarding vessel localization. (P–T) Z-stack projection (P–R) and reconstruction (S,T) of the melanoma TME live imaging 24 h after transplantation. Images represent a Z projection (Z = 74 slices) of the TME. (R) In the images, two cancer cells detach from the primary mass following the vessels (red arrows). (T) The white arrow represents cancer cell migration and dissemination from primary mass.
|
