
Figure 4
- ID
- ZDB-FIG-231002-21
- Publication
- Feierstein et al., 2023 - Dimensionality reduction reveals separate translation and rotation populations in the zebrafish hindbrain
- Other Figures
- All Figure Page
- Back to All Figure Page
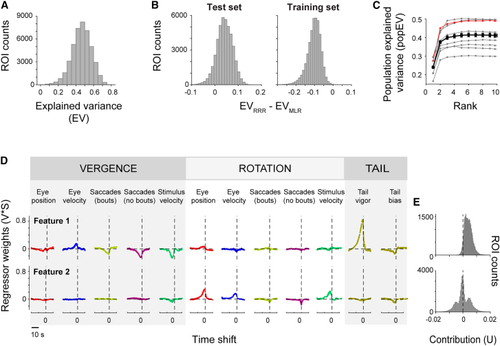
Activity is explained by a small number of features that separate vergence and rotation variables (A) Explained variance (EV; cross-validated) for the ROIs of an example fish using RRR. (B) The cross-validated explained variance of the best RRR model (EVRRR) was generally higher than the explained variance of the best MLR model (EVMLR) (left). Right shows performance on training data, i.e., without cross-validation. Same fish as in (A). (C) Population-explained variance (popEV, cross-validated; see (D) The first two features for the example fish. Feature traces are scaled by their overall importance (V∗S; see (E) Contribution of the latent regressors associated with features 1 (vergence) and 2 (rotation) to ROI activity for the same example fish (43,622 ROIs). See also |