
Fig. 3
- ID
- ZDB-FIG-230905-7
- Publication
- Mishra-Gorur et al., 2023 - Pleiotropic role of TRAF7 in skull-base meningiomas and congenital heart disease
- Other Figures
- All Figure Page
- Back to All Figure Page
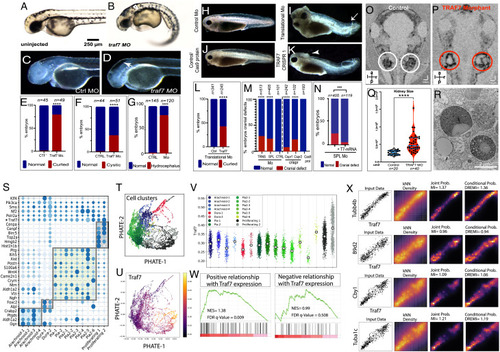
Reduction of TRAF7 causes ciliopathy phenotypes in zebrafish (A–G) and Xenopus tropicalis (H–R), and single-cell transcriptomic analysis reveals TRAF7 association with cilia-related genes (S–V). (A and B) Pronephric cysts and axial curvature in 2.5 dpf Traf7 morphant zebrafish larva (A) but not control (B). Embryos exhibit substantial ventrally directed curling and cysts that appear as small spherical clearings in the pronephros (arrowhead). (C and D) Hydrocephalus in 2 dpf embryos following injection of TRAF7 splice-site (R), but not control (Q), MO at the 1-cell stage. Quantification of embryos presenting with hydrocephalus (S) ****: P < 0.0001 (two-sided Fisher’s exact test, n= # of embryos). (E) Quantification of curled-down phenotype. This occurs in ~75% of MO-injected embryos, but never in controls. ****: P < 0.0001 (two-sided Fisher’s exact test, n= # of embryos). (F) Quantification of cystic phenotype. This appears in ~33% of MO-injected embryos, but never in controls. ****: P < 0.0001 (two-sided Fisher’s exact test, n= # of embryos). (G) Quantification of hydrocephalus phenotype. This appears ~75% of the time in injected fish, but never in uninjected controls. ****: P < 0.0001 (two-sided Fisher’s exact test, n= # of embryos). (H–N) Hydrocephalus and cranial (arrowheads) and tail (arrows) defects in 2 dpf (stage 38-39) in X. tropicalis embryos injected with translational (I) but not control (H) MO, or with CRISPR/Cas9 targeting TRAF7 (K), but not Cas9 alone (J). Scale bar: 200 μm. (L) Quantification of curled tail phenotype. This appears in ~47% of MO-injected embryos, but never in controls. ****: P < 0.0001 (two-sided Fisher’s exact test, n = # of embryos); (M) Quantification of hydrocephalus/cranial defect phenotype. This appears in embryos injected with translational morpholino (~30%) and splice-site morpholino (~25%), but never in embryos injected with control morpholino. CRISPR2 injections are more effective (~25%) than CRISPR 1 (~12%) as compared to CAS9 in eliciting cranial defect phenotype. ****: P < 0.0001 (two-sided Fisher’s exact test, n= # of embryos); (N) Rescue of cranial defects upon coinjection of 100 pg of WT-TRAF7 mRNA and splice-site TRAF7-MO. n = number of embryos. ***: P < 0.001 (two-sided Fisher’s exact test, n = # of embryos). (O–R) Traf7 morphant (P) but not control (O) X. tropicalis embryos exhibit enlarged kidneys at 5 dpf as visualized by OCT; (Q) Quantification of kidney size: TRAF7 morphant embryos show a variable but overall significant increase in kidney size as compared to control embryos (Movie S5). ****: P < 0.0001 (two-sided Fisher’s exact test, n= # of embryos); (R) Transmission electron microscopic analysis of the developing pronephros at 5 dpf shows large vesicular bodies suggestive of precystic kidneys. (S–X) scRNAseq analysis of E14.5 mouse meninges obtained from publicly available data (25). Dot plot showing mean expression for marker genes for the arachnoid, dura, pia, and proliferating cell clusters. The size and color density of the dots represent fraction of cells expressing the gene in the groups and mean expression, respectively. Shaded rectangles indicate genes enriched in cell clusters. * Indicating the relative expression of Traf7 within cell clusters (S). PHATE plot showing different cell clusters in scRNAseq data in (S). Colors representing cell clusters [see panel V] (T). PHATE plot demonstrating Traf7 expression profile in mouse meningeal cell clusters (U). Jitter plot showing enrichment of Traf7 in proliferating meningeal cluster, more prominently in Proliferating-2 subcluster (V). Gene set enrichment analysis (GSEA) indicating the enrichment of cilia-related genes (obtained from CiliaCarta Database) within the genes that show positive (Left) or negative (Right) association with Traf7 expression in knn-DREMI analysis. Positively associated genes demonstrating significant enrichment for cilia-related genes, while negatively associated genes do not. NES: Normalized enrichment score (W). Representative DREVI plots for the cilia-related genes showing strong positive relationship with Traf7 expression in knn-DREMI analysis (X). |
| Fish: | |
|---|---|
| Knockdown Reagent: | |
| Observed In: | |
| Stage: | Long-pec |