
Figure 6—figure supplement 1.
- ID
- ZDB-FIG-230822-9
- Publication
- Zylbertal et al., 2023 - Recurrent network interactions explain tectal response variability and experience-dependent behavior
- Other Figures
- All Figure Page
- Back to All Figure Page
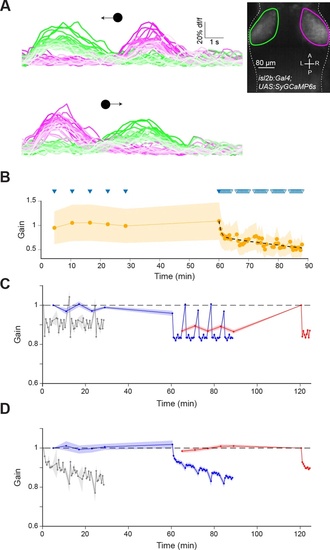
(A) Calcium imaging of RGC axon terminals in OT in an isl2b:GAL4;UAS:SyGC6s transgenic larva during leftward (top) and rightward (bottom) moving spot stimuli. Faint lines indicate later presentations. Inset: Mean z-projection of an image volume showing the left (green) and right (magenta) ROIs containing RGC axon terminals in the tectum. (B) RGC axon terminal responses (n=4 fish) normalised by the mean of the first two responses in each fish. Triangles indicate stimulus presentation times, filled triangles indicate epochs used to establish the ‘baseline’ response. Data from left and right OT were averaged. (C) Model prediction as per Figure 6, but without implementing RGC adaptation. (D) The net effect of simulated RGC adaptation, computed by taking the difference between the model prediction with and without RGC adaptation. Shaded areas indicate SEM. |