
Figure 7
- ID
- ZDB-FIG-230323-11
- Publication
- Zylbertal et al., 2023 - Recurrent network interactions explain tectal response variability and experience-dependent behavior
- Other Figures
- All Figure Page
- Back to All Figure Page
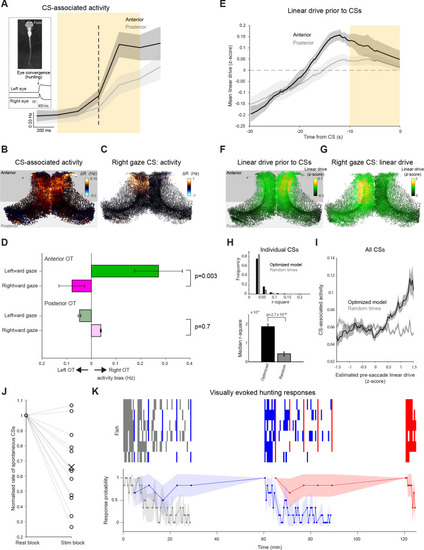
(A) Activity of neurons in the anterior (black) and posterior (grey) OT, triggered on spontaneous CSs. Mean with shaded areas indicating SEM (n=11 fish), dashed line indicates CS time. Inset: Eye tracking and an example of a detected convergent saccade. (B) Mean baseline-subtracted activity of OT cells during 1 s windows centred on spontaneous CSs (orange rectangle in (A), n=66 CSs in a single fish). (C) Baseline-subtracted activity for a single spontaneous CS with rightward post-saccade gaze angle. (D) Comparisons of activity between OT hemispheres for lateralized CSs with leftward (green) and rightward (magenta) post-saccade gaze angle. Error bars indicate SEM (n=408 CSs from 11 fish). (E) Linear drive in the anterior (black) and posterior (grey) OT, prior to CSs, estimated using optimized model parameters and 60 seconds of pre-saccade ongoing activity. Mean with shaded area indicating SEM (n=11 fish). Dashed line indicates baseline linear drive. (F) Linear drive of OT cells during the 10 s prior to spontaneous CSs (orange rectangle in (E), in the same fish depicted in (B), n=66 CSs). (G) Linear drive prior to the spontaneous CS shown in (C). (H) Top: Distribution of r2 values for linear fits of CS-associated activity as a function of estimated linear drive (with a positive slope constraint). Linear drive (‘excitability’) of individual neurons was estimated using optimized model parameters and 60 s of pre-saccade ongoing activity (black) or randomly chosen sequences of ongoing activity (grey). 680 CSs from 11 fish. Bottom: median r2 values, error bars indicate ±1%, p-values for a Wilcoxon signed rank test. (I) For each of the CSs, the mean across neurons of CS-associated activity was computed for bins of estimated linear drive. Shaded area indicates bin-wise SEM. (J) Rate of spontaneous CSs during rest blocks (more than 120 s since the last visual stimulus presentation) vs visual stimulation blocks, normalised by rest block rate. Each line indicates one fish. (K) Prey-catching responses evoked by very low (grey), high (blue), and low (red) elevation stimuli, presented according to the protocol described in Figure 6. Top raster show responses from each of six animals (rows) and lower trace shows mean response probability with 90% confidence interval. |