
FIGURE
Figure 7
- ID
- ZDB-FIG-230814-29
- Publication
- Ge et al., 2023 - Transcriptome Analysis Reveals the Molecular Basis of Overfeeding-Induced Diabetes in Zebrafish
- Other Figures
- All Figure Page
- Back to All Figure Page
Figure 7
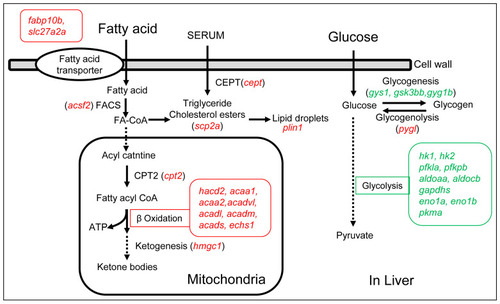
The diagram of the up- and down-regulated genes in the signaling pathways of fatty acid metabolism and glucose metabolism in the livers of the overfed group. The letters in italic and red represent up-regulated genes, the letters in italic and green represent down-regulated genes. |
Expression Data
Expression Detail
Antibody Labeling
Phenotype Data
Phenotype Detail
Acknowledgments
This image is the copyrighted work of the attributed author or publisher, and
ZFIN has permission only to display this image to its users.
Additional permissions should be obtained from the applicable author or publisher of the image.
Full text @ Int. J. Mol. Sci.