
- Title
-
Transcriptome Analysis Reveals the Molecular Basis of Overfeeding-Induced Diabetes in Zebrafish
- Authors
- Ge, G., Ren, J., Song, G., Li, Q., Cui, Z.
- Source
- Full text @ Int. J. Mol. Sci.
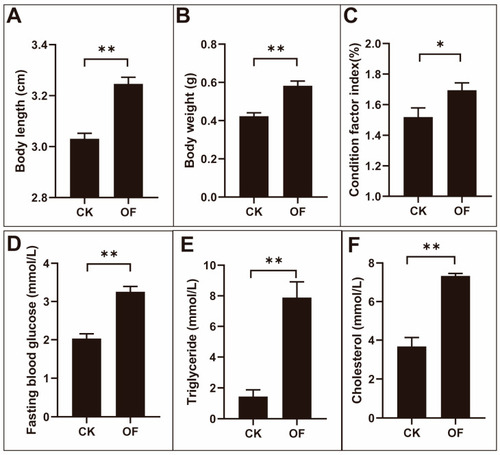
The variation of body index, fasting blood glucose, triglycerides, and total cholesterol in male zebrafish after overfeeding. The body length ( PHENOTYPE:
|
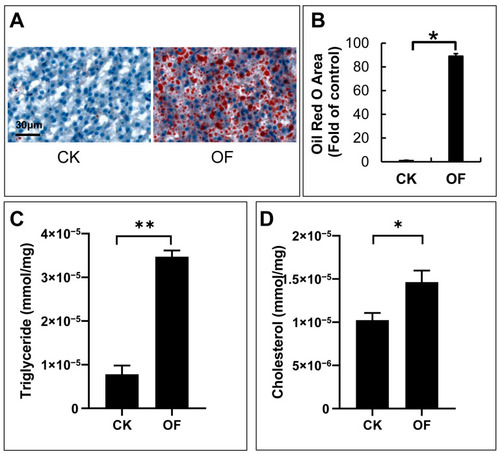
Accumulation of lipid droplets in livers of overfed zebrafish. Images of Oil Red O staining for section of livers in control and overfed groups ( PHENOTYPE:
|
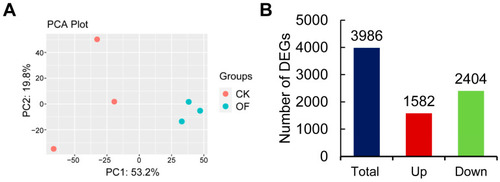
The results of data analysis for the transcriptome of livers in control and overfed groups. Principal component analysis (PCA) of gene expression profiles for differentially expressed genes ( |
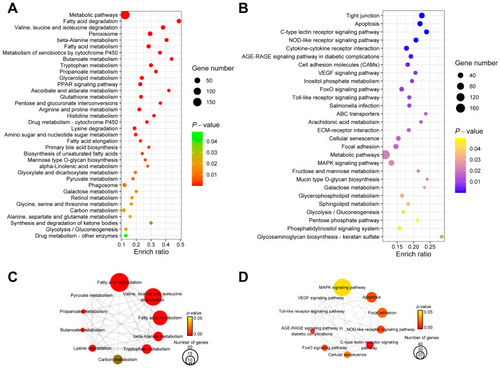
The results of KEGG enrichment analysis for DEGs in livers after overfeeding. Dot plot of KEGG enrichment analysis results for up-regulated DEGs ( |
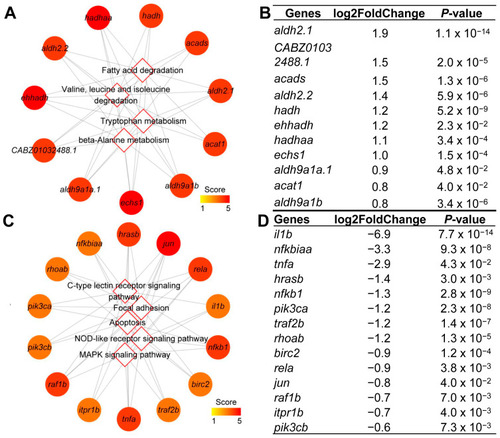
Identified hub genes in the hub pathways. Network of the 11 hub genes mapped to top 4 hub pathways enriched from up-regulated DEGs ( |
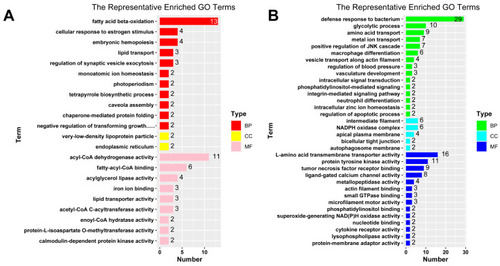
Bar plots for representative terms of GO enrichment analysis. The GO terms for up-regulated DEGs ( |
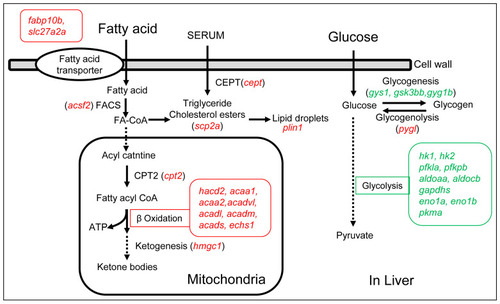
The diagram of the up- and down-regulated genes in the signaling pathways of fatty acid metabolism and glucose metabolism in the livers of the overfed group. The letters in italic and red represent up-regulated genes, the letters in italic and green represent down-regulated genes. |