
FIGURE
Figure 4
- ID
- ZDB-FIG-230814-26
- Publication
- Ge et al., 2023 - Transcriptome Analysis Reveals the Molecular Basis of Overfeeding-Induced Diabetes in Zebrafish
- Other Figures
- All Figure Page
- Back to All Figure Page
Figure 4
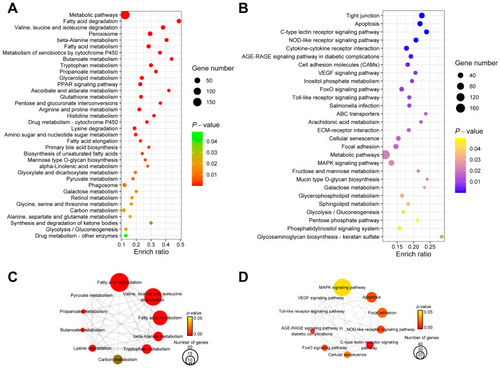
The results of KEGG enrichment analysis for DEGs in livers after overfeeding. Dot plot of KEGG enrichment analysis results for up-regulated DEGs ( |
Expression Data
Expression Detail
Antibody Labeling
Phenotype Data
Phenotype Detail
Acknowledgments
This image is the copyrighted work of the attributed author or publisher, and
ZFIN has permission only to display this image to its users.
Additional permissions should be obtained from the applicable author or publisher of the image.
Full text @ Int. J. Mol. Sci.