
Figure 6—figure supplement 1.
- ID
- ZDB-FIG-230710-25
- Publication
- Hasel de Carvalho et al., 2023 - The Opto-inflammasome in zebrafish as a tool to study cell and tissue responses to speck formation and cell death
- Other Figures
-
- Figure 1—figure supplement 1.
- Figure 1—figure supplement 1.
- Figure 2.
- Figure 3—figure supplement 1.
- Figure 3—figure supplement 1.
- Figure 4.
- Figure 5.
- Figure 6—figure supplement 1.
- Figure 6—figure supplement 1.
- Figure 6—figure supplement 2.
- Figure 6—figure supplement 3.
- Figure 7—figure supplement 1.
- Figure 7—figure supplement 1.
- Figure 7—figure supplement 2.
- Figure 8—figure supplement 1.
- Figure 8—figure supplement 1.
- Figure 8—figure supplement 2.
- All Figure Page
- Back to All Figure Page
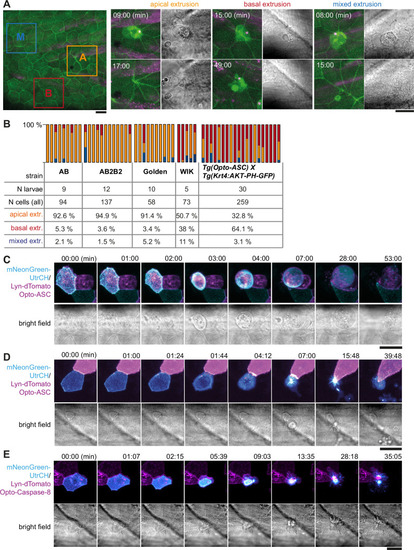
Apical and basal extrusion during Opto-ASC induced cell death. (A) Examples of responses to Opto-ASC (magenta) speck formation in three periderm cells within the same larva (marked by blue, orange and red squares in the overview image); cell borders marked by AKT-PH-GFP, green. Dying periderm cells can be extruded apically (orange), basally (blue) or in both directions (red). (B) Percentage of periderm cells extruded either apically, basally or in both directions (mixed) after Opto-ASC speck formation in different Danio rerio laboratory strains and transgenic Tg(Opto-asc X Krt4:Akt-PH-GFP) larvae. Each bar represents one larva, the y-axis shows what fraction of cells undergoes which type of extrusion. (C–D) Response of the actin cytoskeleton in cells that are apically (C) or basally (D) extruded after formation of an ASC speck (magenta) shown as z-projections. Actin is labeled using mosaic expression of mNeonGreen-UtrCH (cyan). The apical cortical actin ridges can also be seen in bright field images. Membranes of cells are mosaically labeled by expression of lyn-tagRFP (also magenta). (E) Actin response to Opto-Caspase-8-induced apoptosis in periderm cells; actin in the dying cell is in cyan (mNeonGreen-UtrCH). Membranes of cells are mosaically labeled by lyn-tagRFP (also magenta). Scale bars in all images are 20 µm. |